National Self-Storage Investment Outlook — Midyear 2025
NATIONAL ECONOMY
- Momentum entering 2025 was waylaid this spring when the Trump administration began imposing new import taxes on a broad swath of the nation’s trading partners, as well as on specific materials and products. As the administration actively negotiates new trade conditions, the situation remains fluid and inconsistent. Financial markets and consumer confidence are therefore still subject to heightened risk of volatility.
- While the labor market stayed tight through the first five months of this year, reduced hiring intentions could lead to higher unemployment in the months ahead. This could in turn weigh on household formation. That said, the ceiling on unemployment may be reduced if immigration into the U.S. slows, similar to what occurred during President Trump’s first term.
- Returning import taxation levels to those last recorded in the 1930s could have unanticipated consequences for both the national and global economies. Add to this uncertainty the potential for rising geopolitical conflicts abroad, and the risk of a dark horse event occurring later this year cannot be ruled out. As such, current economic projections could shift.
CAPITAL MARKETS
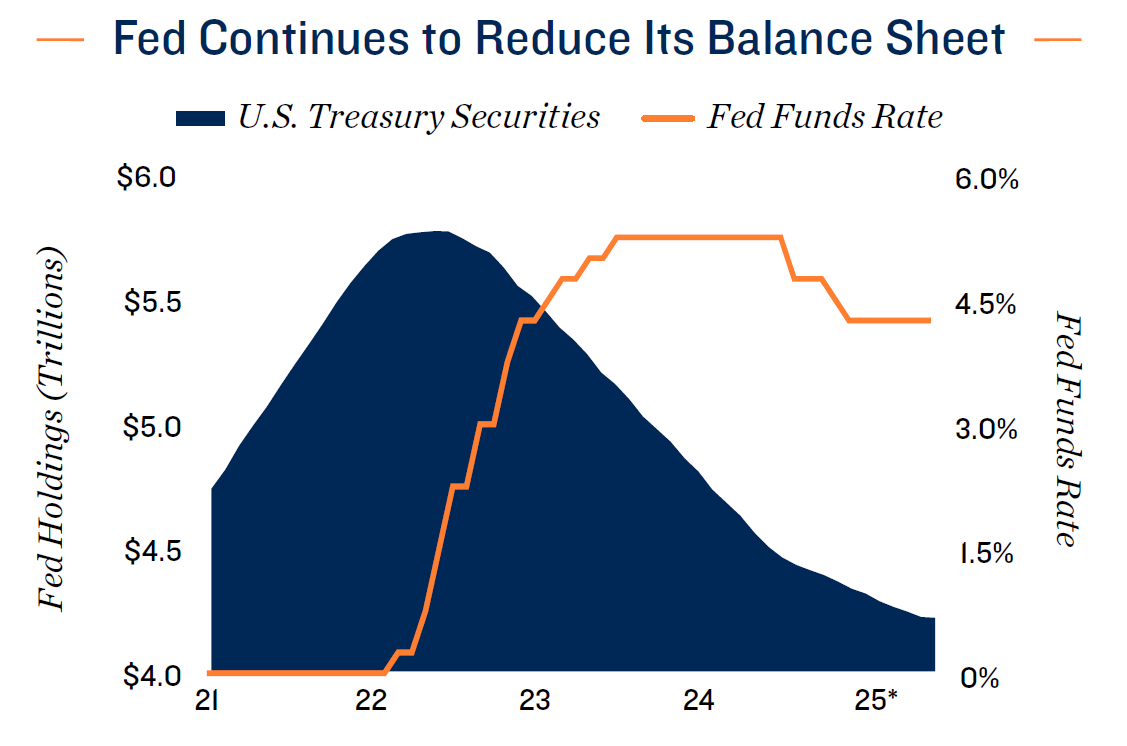
- The Federal Reserve held the overnight lending rate flat at a 4.25 percent lower bound through the first six months of 2025. Any rate reduction in the second half of the year is not guaranteed, as the Trump administration’s numerous policy changes have put the Fed in a wait-and-see posture. A notably weakening labor market could prompt a cut, but risks of higher inflation could also motivate holding rates where they are for now.
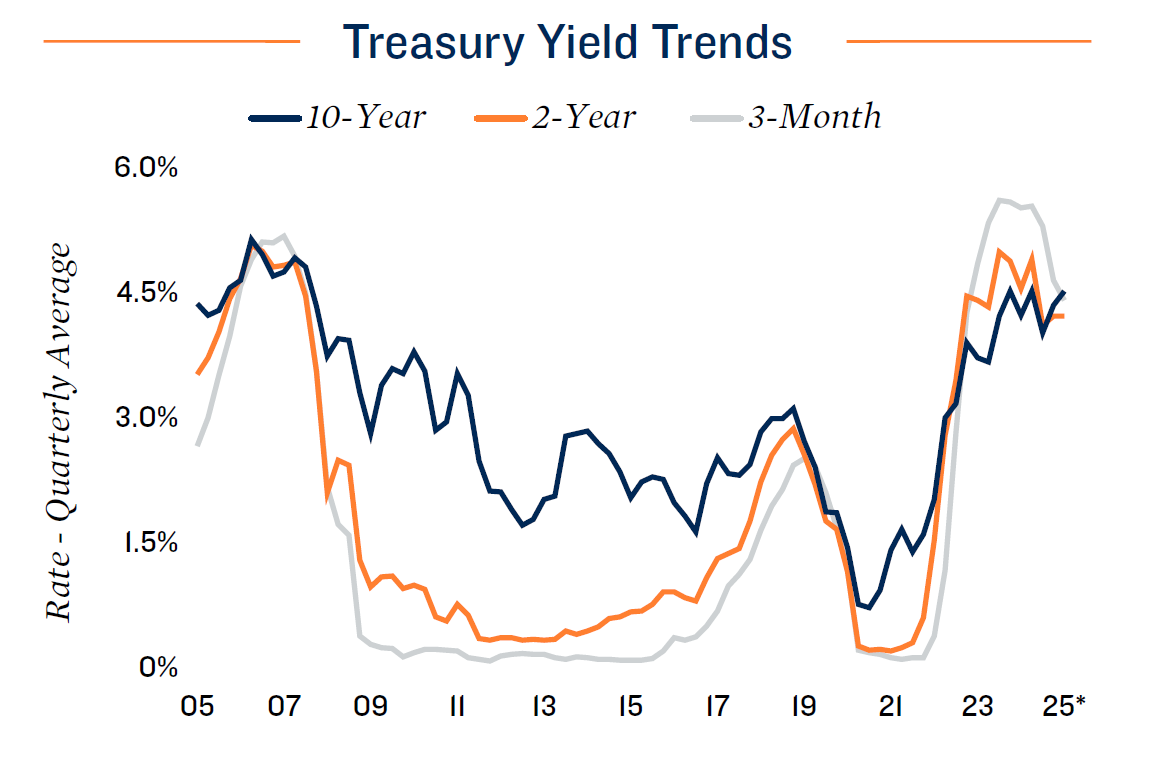
- Longer-term interest rates, meanwhile, face some potential upward pressure. Congress’s budget reconciliation is likely to raise deficit spending in excess of the additional tariff revenues, requiring increased U.S. debt issuance. Given that prominent buyers of U.S. Treasuries, such as the Fed, China and Japan, are less active, prices on the notes may fall, pushing up yields.
- Capital remains generally available for self-storage investment sales. A history of lower default and more granular rent rolls than some other asset types drives some of the appeal among lenders for self-storage properties. Financiers in general continue to favor investors with a proven track record in storage ownership and operations.
NATIONAL SELF-STORAGE OVERVIEW
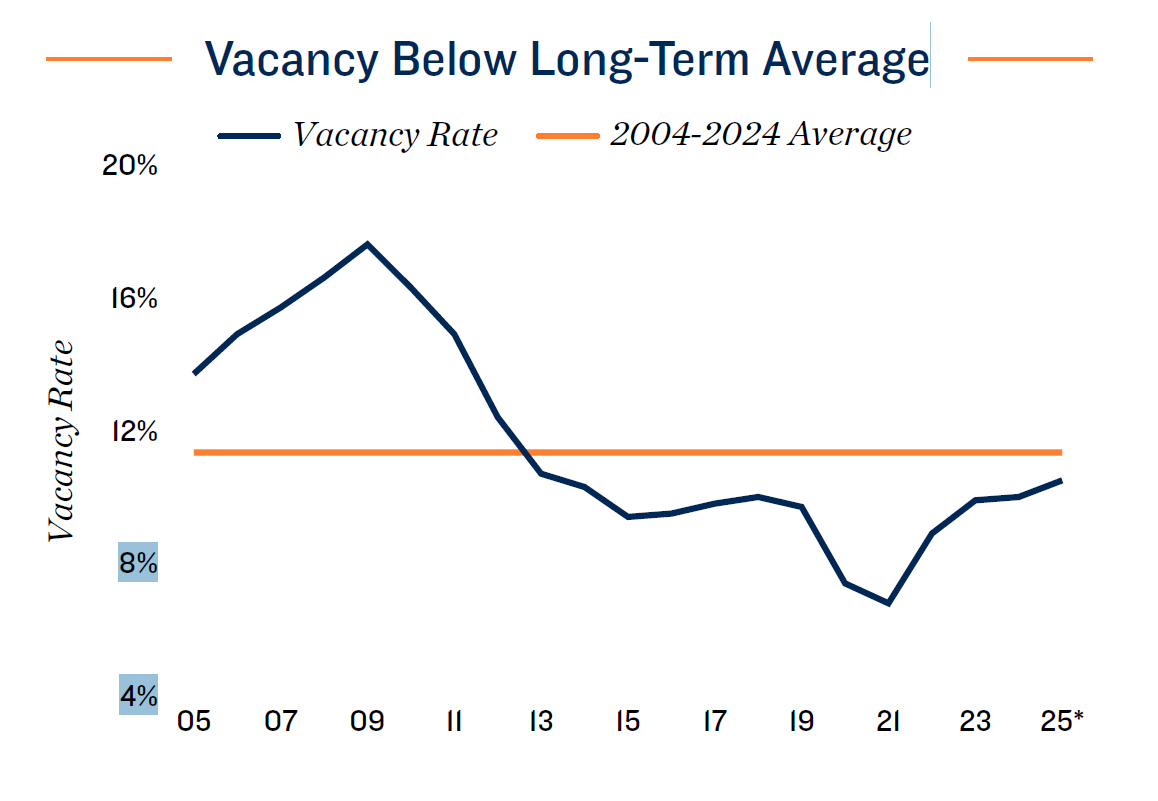
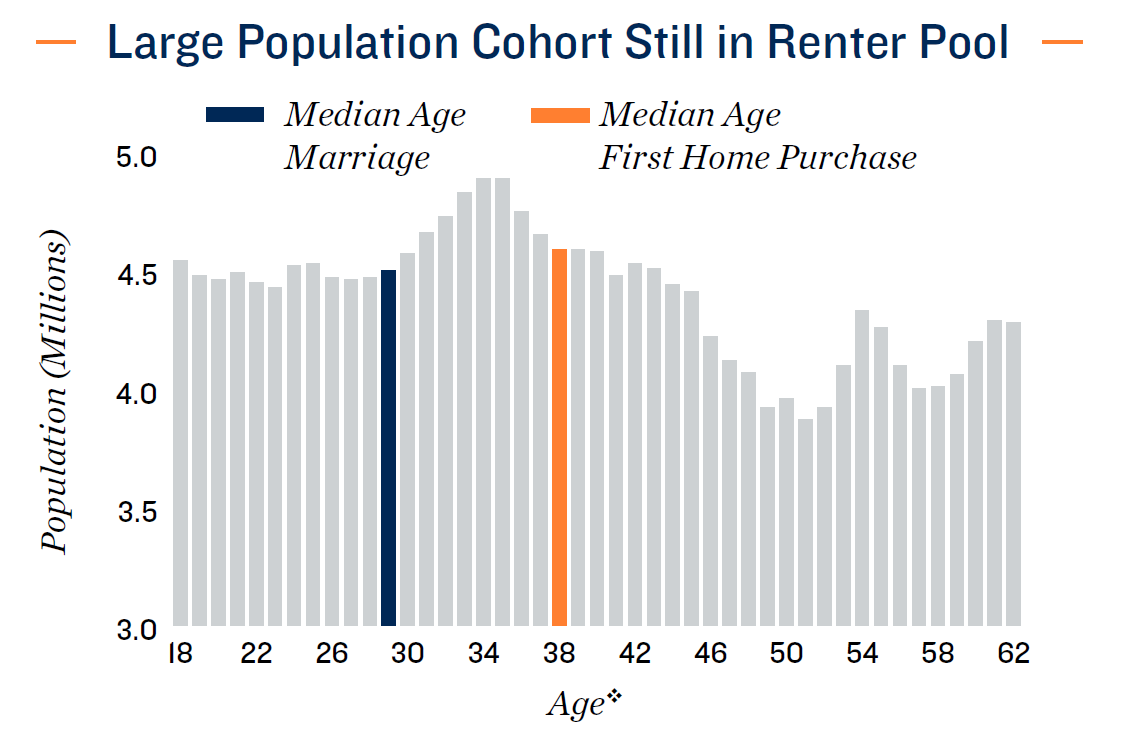
- After shifting by more than 100 basis points in 2020, 2022 and 2023 amid health crisis-related effects, the national self-storage vacancy rate appears poised for less volatility in the near term. First home purchases occurring at a later age amid elevated costs is keeping households in the renter pool longer. As such, the need for a self-storage unit among households may increase.
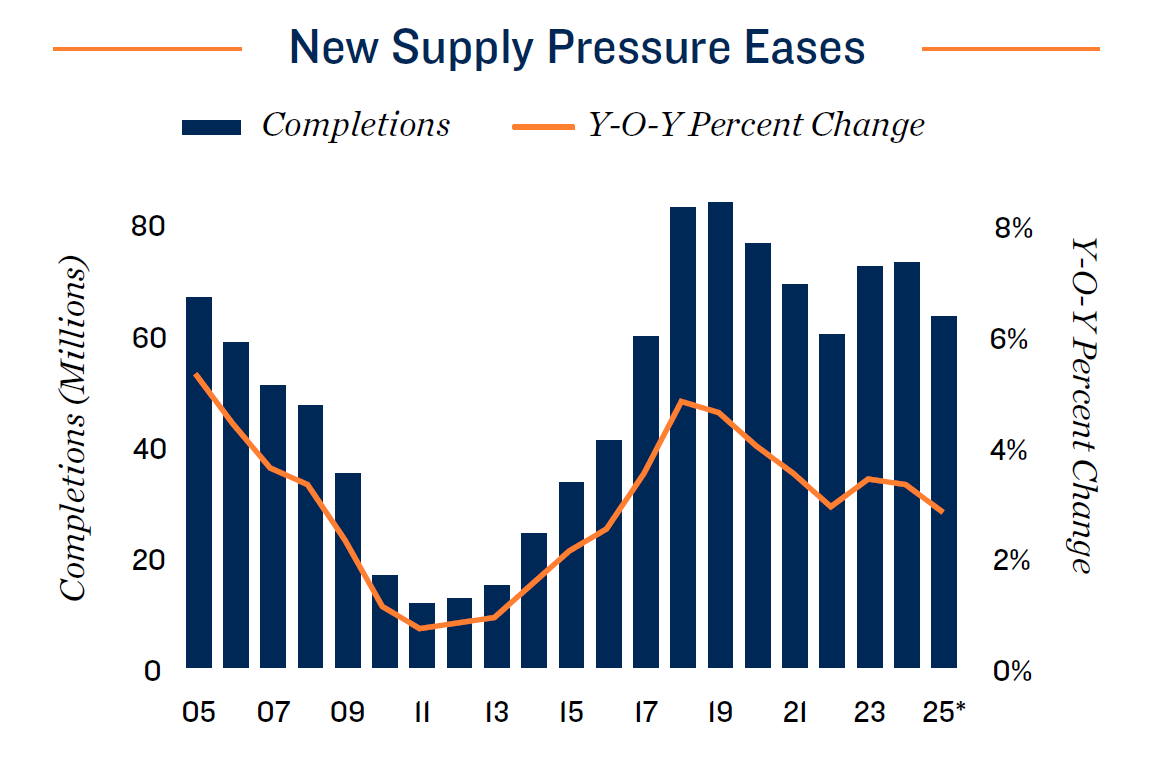
- After peaking at nearly 84 million square feet in 2019, the volume of self-storage completions was poised to ease, but notable occupancy gains in 2020 and 2021 fueled an uptick in development in 2023 and 2024. Yet going through 2025, deliveries appear to once again be moderating, as elevated borrowing costs for construction financing challenge some projects.
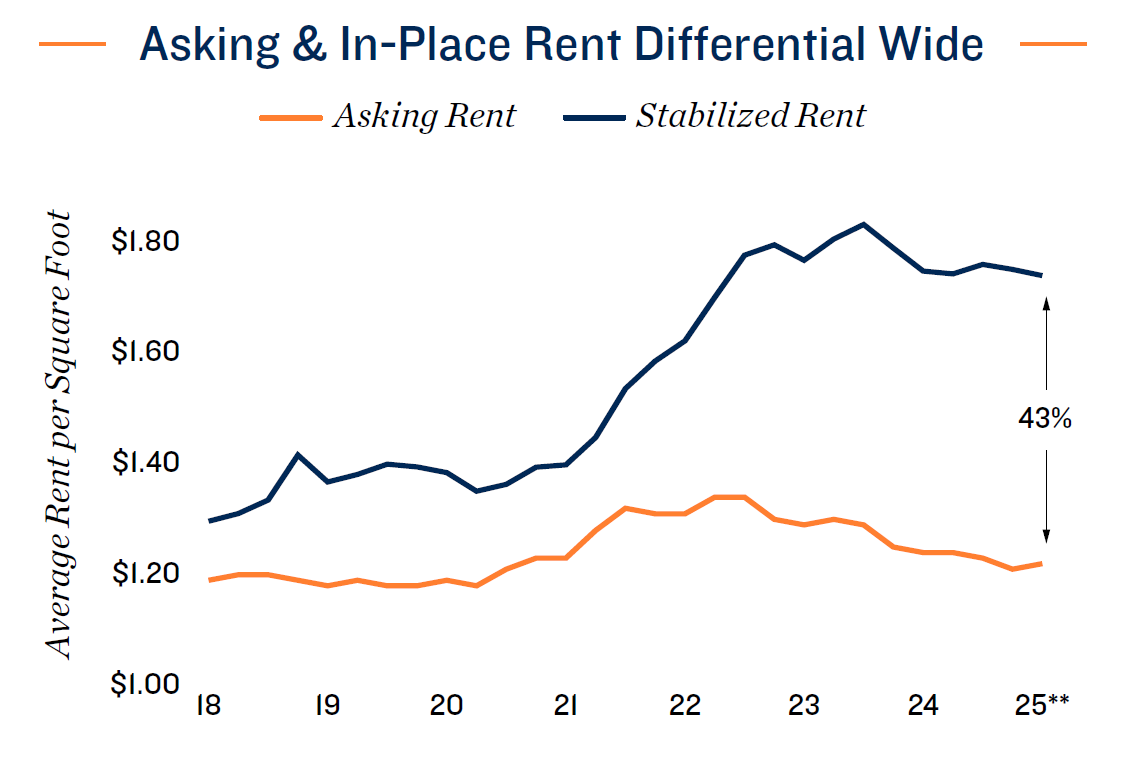
- Flattening demand post-pandemic pressured property efficiency. For some operators, this included greater differentiation between marketed and in-place rents. The effective discount on the street rate has widened from about 6 percent in 2017 to 43 percent in early 2025. Many storage units are rented on a
monthly basis, however, allowing for adjustments over time.
INVESTMENT OUTLOOK
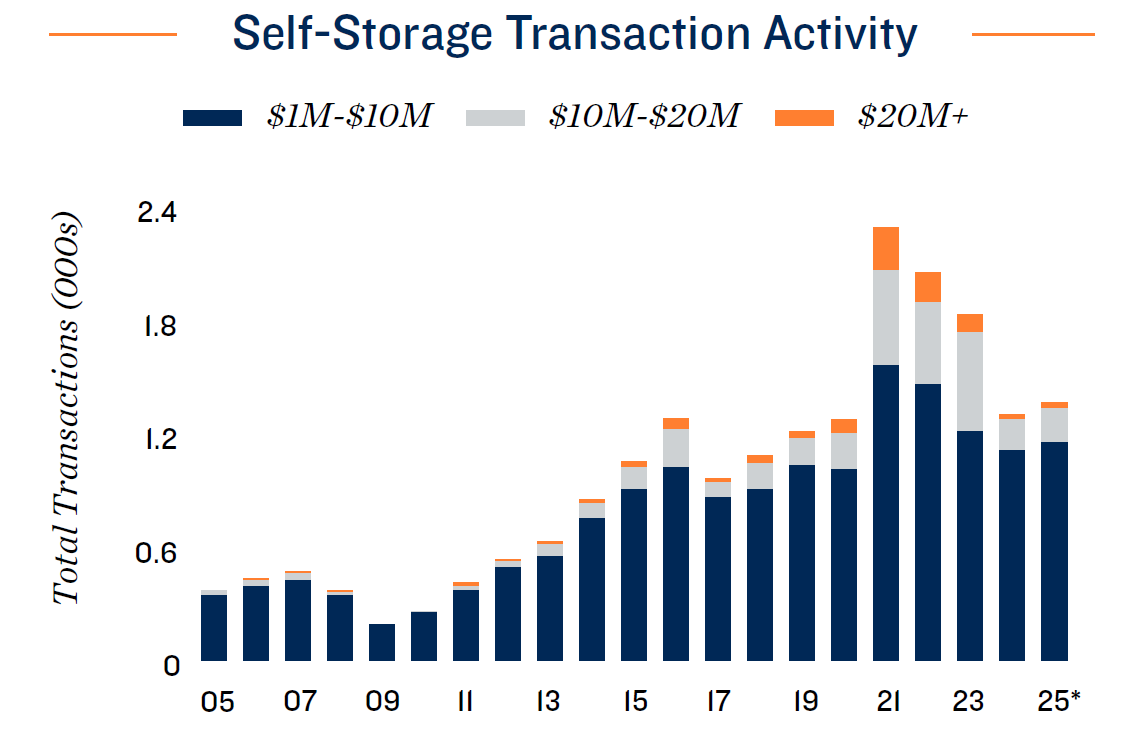
- In contrast to most other property types, self-storage sales activity increased in 2020 and kept climbing through 2022 before retreating. Positive momentum could be back, however, as the number of trades completed in the six months ended March 2025 were up year over year. For investors considering a change in holdings, macroeconomic conditions have raised the potential costs of waiting.
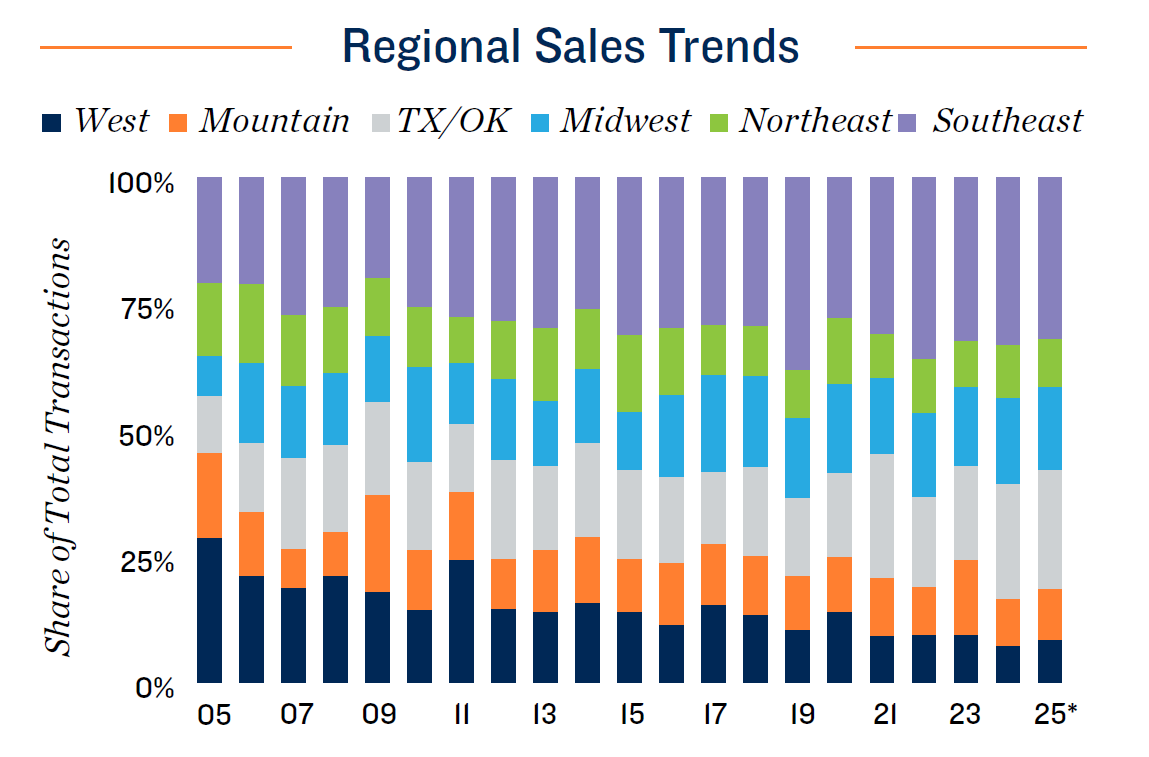
- Sales activity over the past year ended in March picked up across the Southeastern U.S., West Coast and in the Texas/Oklahoma region. The Midwest has ceded some ground, possibly due to less standout demographics. High entry costs also continue to be a barrier along the country’s coasts.
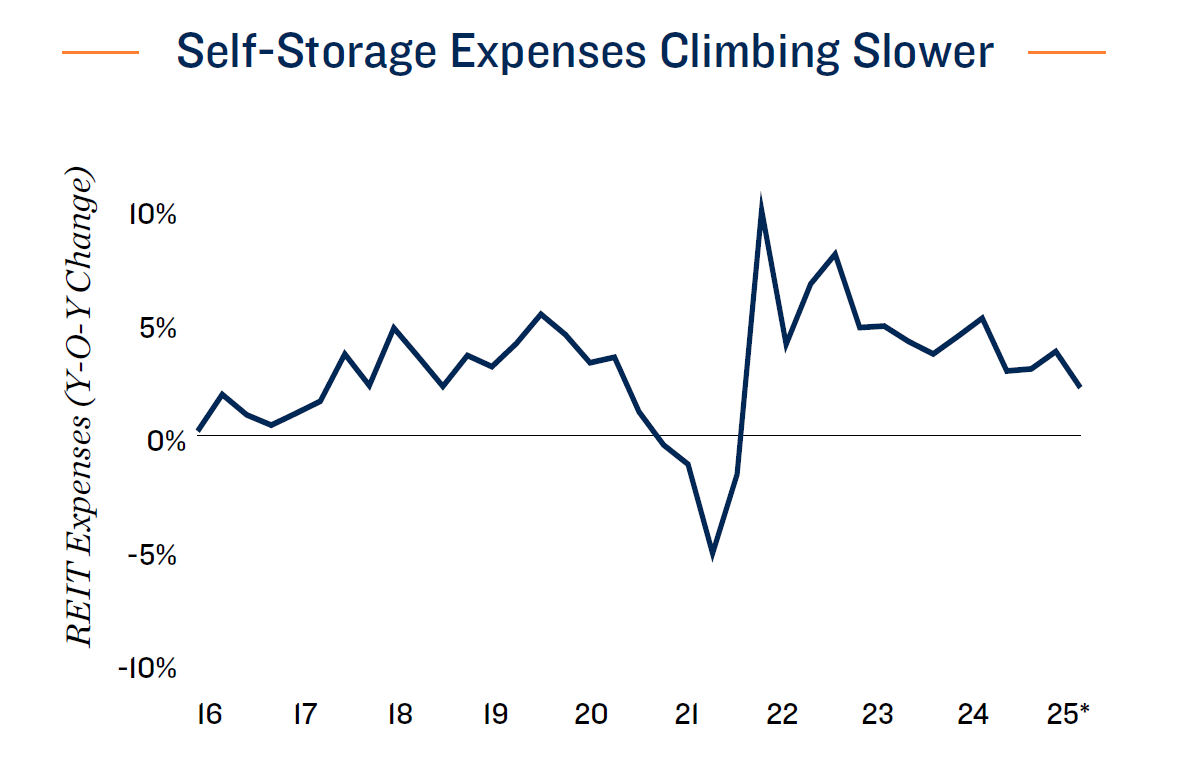
- The cost to own/operate a self-storage facility has been climbing at an elevated rate since late 2021, based on REIT data. Real estate taxes and on-site management fees remain the largest individual expenses, but insurance costs are becoming a greater concern, due to a larger number of extreme weather events and a rise in replacement costs.
ECONOMIC OUTLOOK
Changing U.S. Government Policies Create Uncertainty
for the Economy in the Second Half of 2025
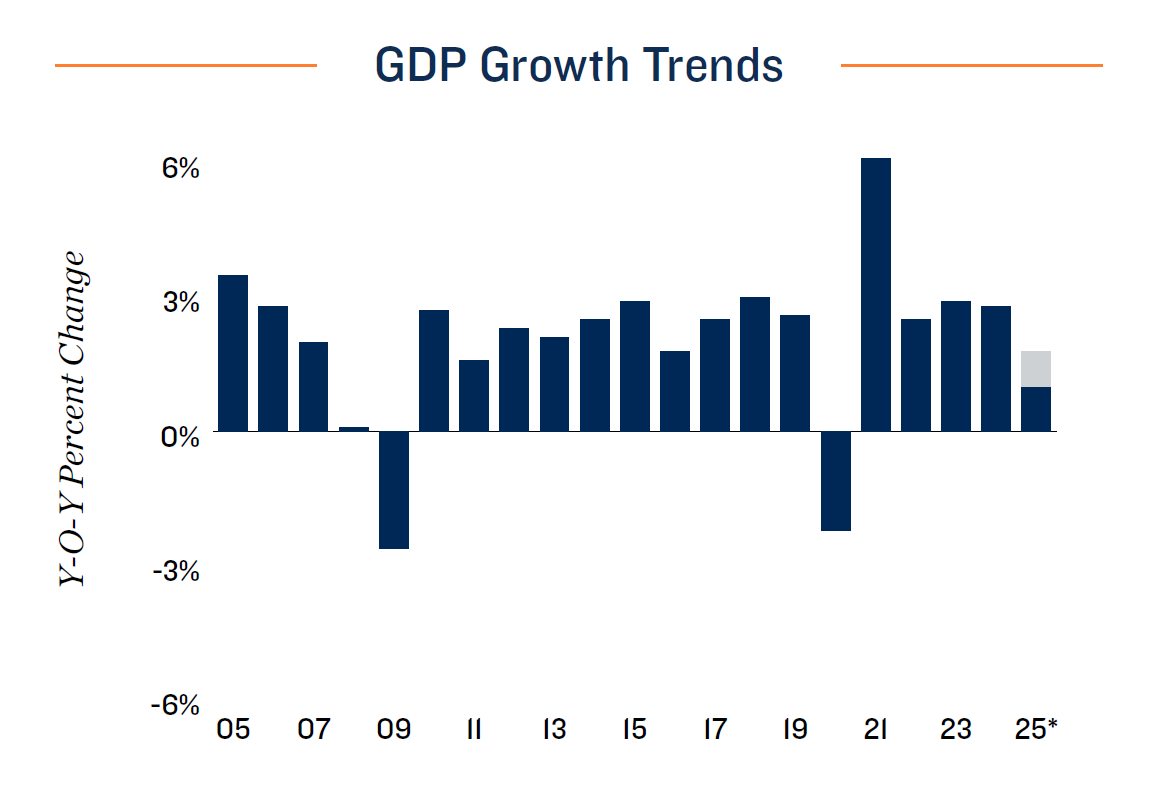
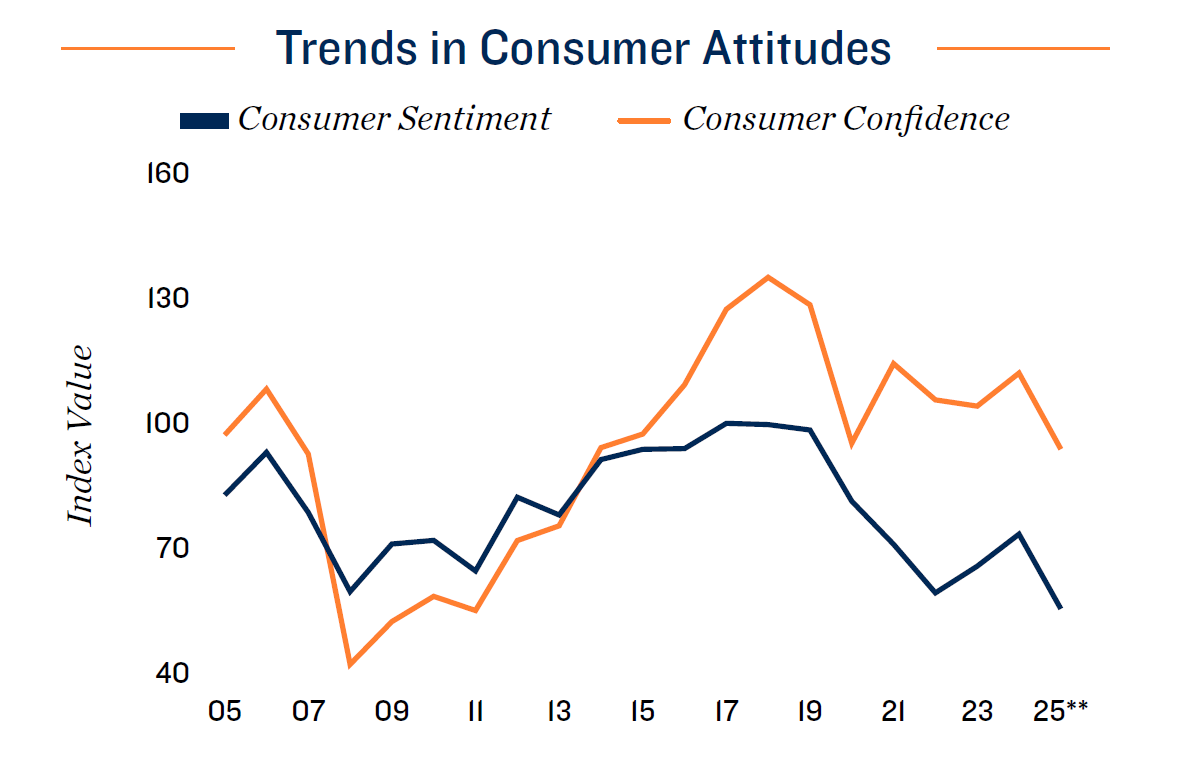
New policies weigh on consumer sentiment, despite favorable economic tailwinds. Following GDP growth of 2.4 percent last year, the U.S. economy entered 2025 on solid footing. The prospect of falling inflation amid sustained low-4 percent unemployment provided a sturdy foundation for ongoing growth. That momentum was waylaid earlier this year when the Trump administration began imposing new import taxes on a broad swath of the nation’s trading partners and specific materials and products. Although the administration is actively negotiating new trade conditions, which has already resulted in less severe tariffs for certain countries, the situation remains fluid and inconsistent. As such, financial markets and consumer confidence are still subject to heightened risk of volatility. The administration’s budget goals are also expected to widen the deficit, while posing a myriad of downstream implications for the funding of various programs and initiatives. Resulting elevated economic uncertainty may lead to dampened household discretionary spending in the months ahead.
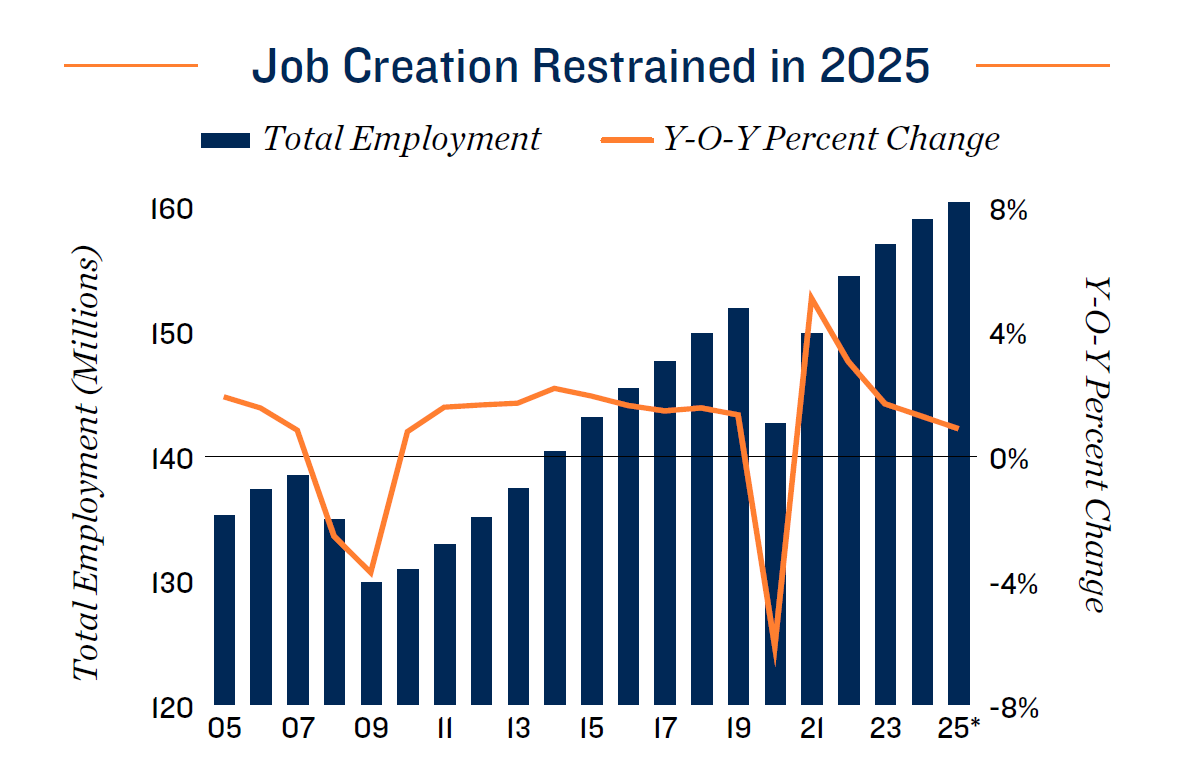
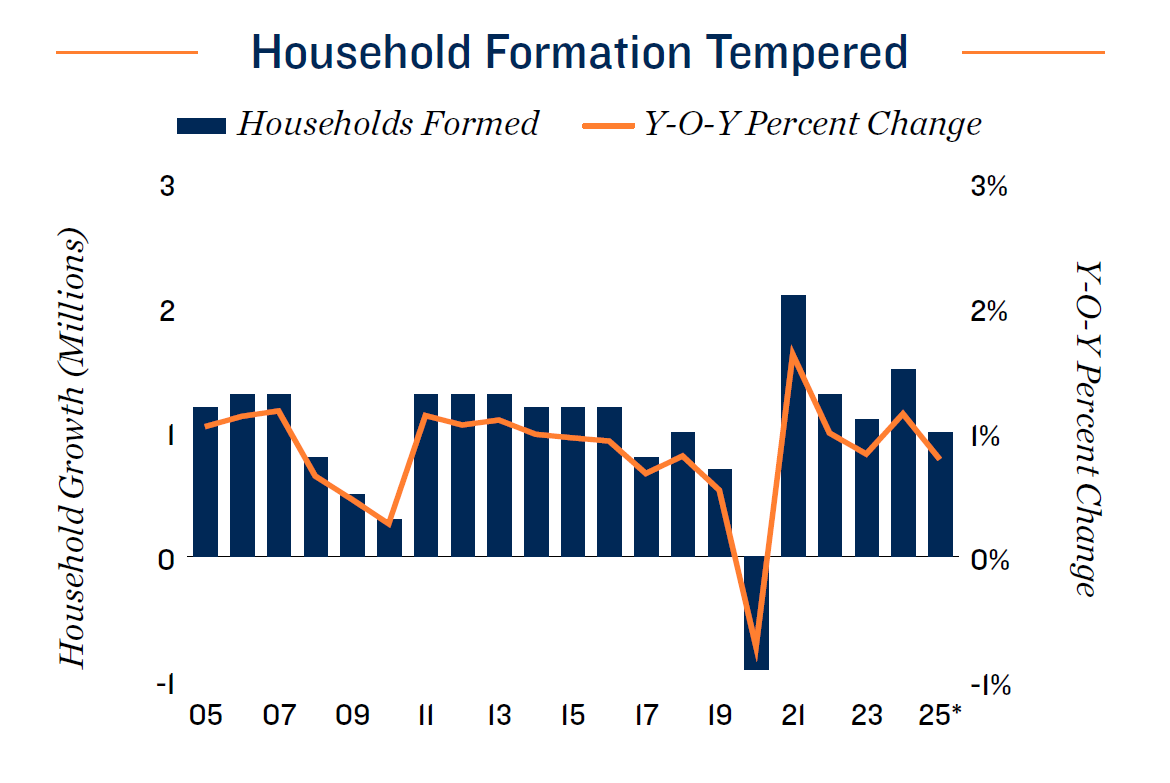
Potential labor market slowdown may further temper household formation. Recent financial market volatility has also impacted business confidence, with some firms indicating intentions to hire fewer recent college graduates this summer. While the labor market stayed tight through the first quarter of this year, reduced hiring intentions could lead to higher unemployment in the months ahead. Although, at 4.2 percent as of May, the unemployment rate could increase 150 basis points before reaching the long-term average. The ceiling on unemployment may also be reduced if immigration into the U.S. slows, similar to what occurred during President Trump’s first term. Nevertheless, the number of job openings nationally was down 3 percent year over year as of April. A lower sense of job security and more individuals seeking employment could weigh on household formation, which decelerated slightly during the opening three months of 2025 after improving over the course of last year.
2025 NATIONAL ECONOMIC OUTLOOK
- Recent migration trends subject to change. As a share of total population, the number of people who have moved within the past year has been on a nearly steady decline since 2006, omitting the pandemic. Migration could be further challenged this year if the economy slows, dissuading households from incurring moving expenses unless necessary. Tempered immigration could also impact population growth, especially in common relocation destinations in states such as Texas and Florida. When compared on a percentage basis, however, states comprising Utah, Idaho and the Dakotas expanded the fastest in 2024. Lower costs of living and job creation in industries such as energy are likely influencing these movements.
- Recent economic shifts create potential for dark horse events. While U.S. trade policy remains in flux, new tariffs implemented so far this year have already massively raised the overall effective rate to about 16 percent as of mid-June. Returning the level of import taxation to those last recorded in the 1930s could have unanticipated consequences for both the national and global economies. Add to this uncertainty the potential for rising geopolitical conflicts abroad, and the risk of a dark horse event occurring later this year cannot be ruled out. As such, current economic projections could shift.
* Forecast
** As of 2Q
SELF-STORAGE OVERVIEW
Shifting Lifestyle Dynamics, Tapering Development
Benefiting Self-Storage as Year Progresses
Delayed homeownership influencing self-storage outlook. After shifting by more than 100 basis points in 2020, 2022 and 2023 amid health crisis-related effects, the national self-storage vacancy rate appears poised for less volatility in the near term. The rate should rise by 50 basis points year over year to 10.3 percent in December. Evolving housing dynamics are aiding the more modest increase. The median age of a first-time homebuyer last year was 38, compared with 33 in 2020. Both marriages occurring later and the rising cost of homeownership are contributing to this delay. As households remain in the renter pool longer, the need for storage may increase. Roughly a quarter of millennial self-storage renters visit their unit at least once a month. Nearly half of the younger Gen Z cohort visit as often. High homeownership barriers nevertheless pose other challenges. The number of annualized home sales fell to an 11-year low at the beginning of 2023, where the metric has hovered since. A less liquid housing market, in turn, constrains relocations — a major driver of temporary self-storage demand. That said, the housing market may be beginning to thaw, as the month’s supply of existing homes rose over the past year ended in April.
Easing development further aids supply-demand balance. After peaking at nearly 84 million square feet completed in 2019, the volume of self-storage construction was poised to ease over the subsequent years; however, notable occupancy improvements in 2020 and 2021 fueled an uptick in development in 2023 and 2024. This new supply pressure occurred alongside a normalization in pandemic self-storage demand, leading to higher vacancy. Yet going into 2025, deliveries appear to once again be moderating, as elevated borrowing costs for construction financing challenge some projects. Openings are also fairly condensed; a quarter of the total expected square feet are contained within only eight major metros or regions, among which are Atlanta, Houston and Southeast Florida. Meanwhile, 11 major markets will welcome less than 500,000 square feet in 2025, including San Diego, St. Louis and Denver. As a result, many of these markets will note a decline or only slight increase in their vacancy this year.
2025 NATIONAL SELF-STORAGE OUTLOOK
- The tale of two rents. Flattening demand after the pandemic placed pressure on property efficiency. For some operators, this included greater differentiation between marketed and in-place rents. While the average asking rent fell 7.6 percent over the past three years, the mean stabilized rent climbed 7.3 percent. The effective discount on the street rate has widened from about 6 percent in 2017 to 43 percent in early 2025. Larger self-storage operators are emphasizing up-front occupancy and drawing out revenue improvements over time. Many storage units are rented on a monthly basis, allowing for quick adjustments responding to forces such as inflation.
- Commercial users smaller but important cohort. Amid a softer period of economic growth, businesses looking to streamline costs could turn to self-storage over traditional warehousing options. On a per-square-foot basis, the average self-storage asking rent is nearly a tenth of the mean for the industrial sector. Enterprises that need ample storage space will still be best served by warehouses, but for companies with more modest requirements, self-storage units can be an appealing alternative. Businesses already make up about 30 percent of all self-storage renters.
* Forecast
** As of 1Q
* As of 2025
CAPITAL MARKETS
Motivations to Wait for Interest Rate Cut Retreat;
Lenders Remain Open to Self-Storage
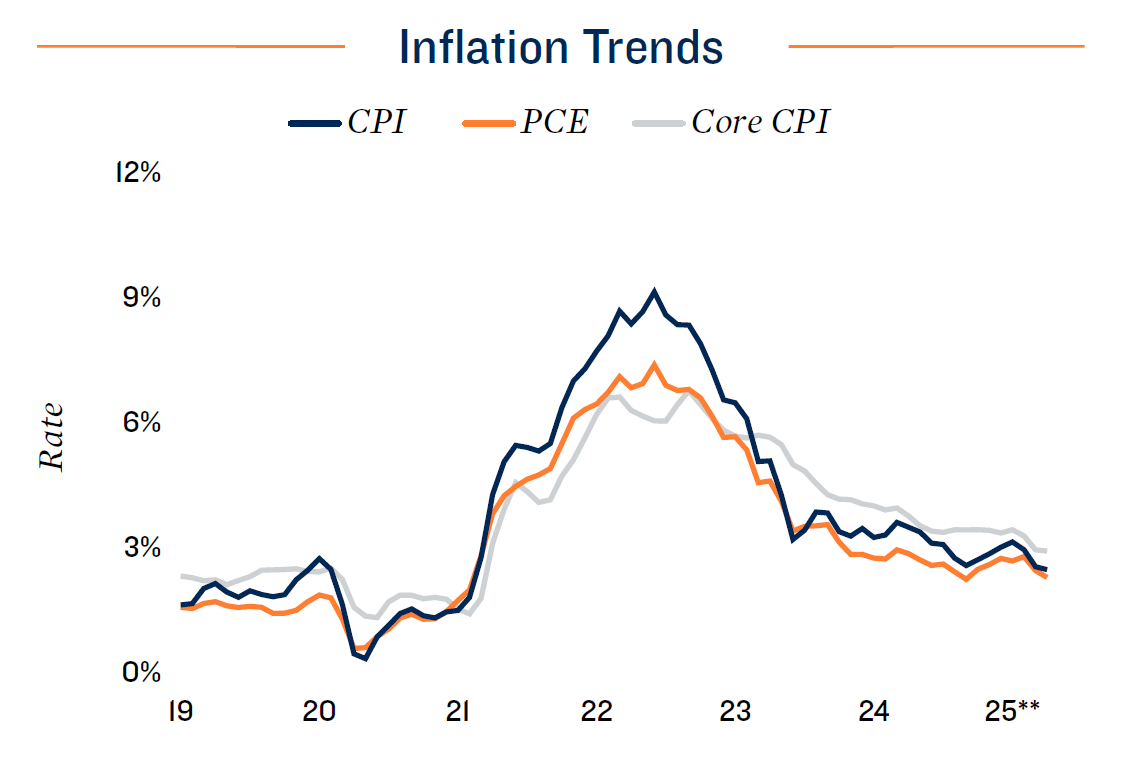
Outlook signals flat to higher interest rates. The Federal Reserve held the overnight lending rate flat at a 4.25 percent lower bound through the first six months of 2025. Any further rate reductions later this year are not guaranteed, as the Trump administration’s numerous policy changes have put the Fed in a wait-and-see posture. One factor that could prompt a rate cut would be a weakening labor market. While the pace of hiring has slowed, unemployment remained low at 4.2 percent as of May. At the same time, the full inflationary impact of new tariffs have yet to be felt. The drop in overseas shipping first noted in April is making its way into production pipelines and store shelves. Long-term interest rates, meanwhile, face some potential upward pressure. Congress’s budget reconciliation is likely to raise deficit spending in excess of the additional tariff revenues, requiring increased U.S. debt issuance. Given that prominent buyers of U.S. Treasuries such as the Fed, China and Japan are less active, prices on the notes may fall, pushing up yields. This would have a direct impact on borrowing costs for loans with longer terms, which are common among commercial real estate transactions.
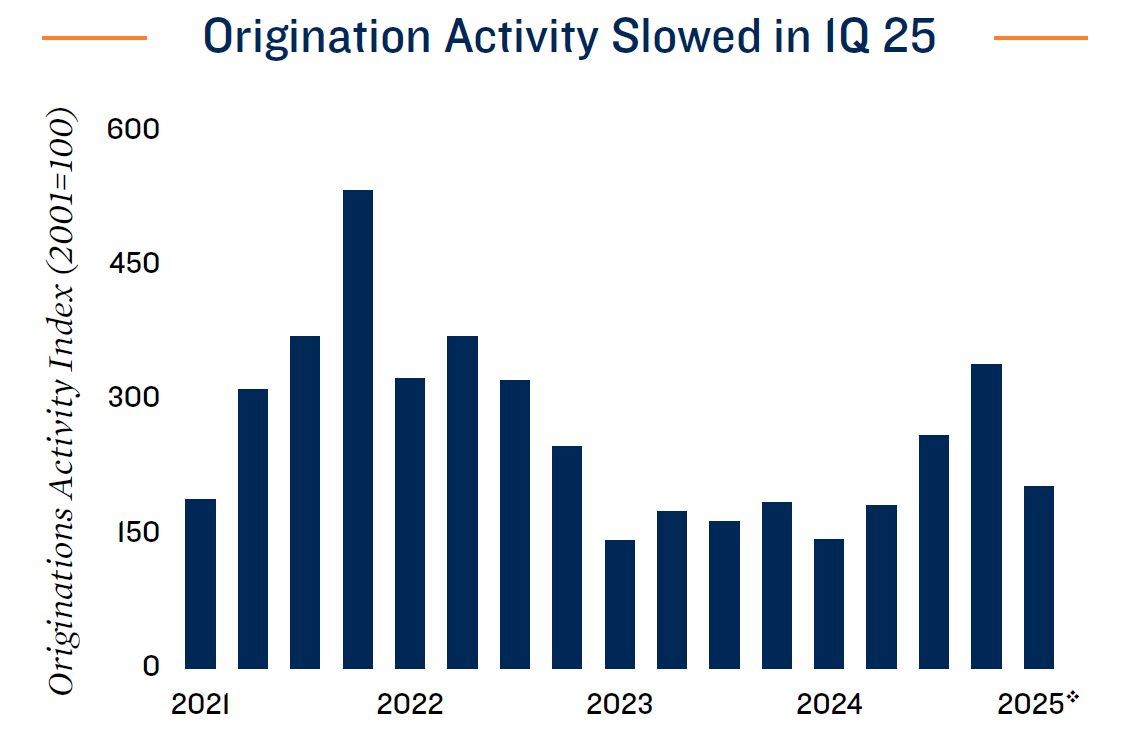
Capital remains generally available for self-storage investment sales. Despite still-elevated borrowing costs, quarterly origination activity picked up over the course of 2024, with self-storage continuing to be one of the more approachable property types for lenders. A history of lower default and more granular rent rolls than some other asset types drove some of this appeal. CMBS lending has been competitive for fixed rate, non-recourse requests. Local and regional banks are also active in the sector. Borrowers requiring lower leverage may also approach life insurance companies when pursuing high-quality properties. Lenders in general continue to favor investors with a proven track record in storage ownership and operations.
2025 CAPITAL MARKETS OUTLOOK
- Market for contemporary builds aided by positive fundamentals. The mean occupancy at sale for properties build after 2017 was above 95 percent during the four-quarter period ending in March. This suggests stabilized assets are drawing investor and lender attention during a stretch of elevated supply pressure. Such transactions made up about 20 percent of activity completed over that yearlong span.
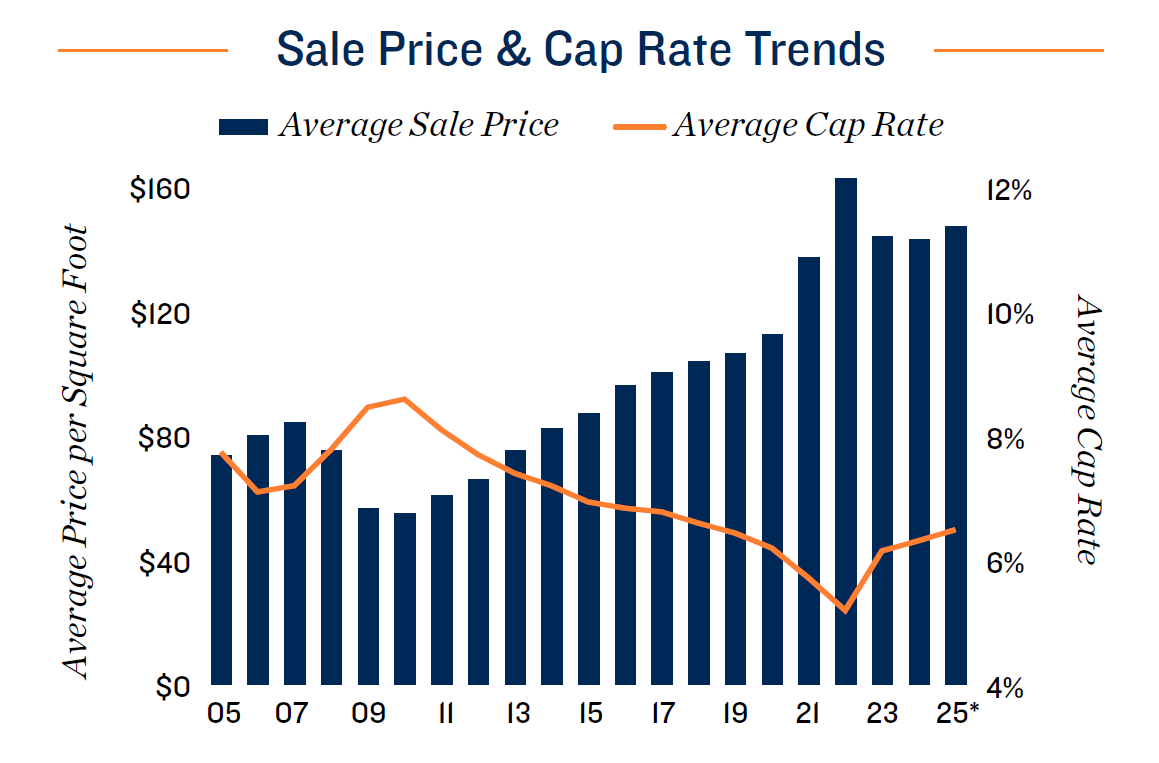
- Borrowing costs remain close to cap rates. Lending conditions will continue to change throughout the year, but as of mid-2025, self-storage borrowers most often faced rates in the mid-5 percent to mid-6 percent band. Rates for CMBS loans skewed 100 basis points higher but are the main avenue for non-recourse. Loan-tovalue ratios were generally in the 60 percent to 70 percent zone. As sales completed over the year ended March produced a mean cap rate of 6.5 percent, these borrowing costs imply buyer and seller expectations will need further alignment.
- Outside factors affecting capital markets. Conflict in the Middle East presents a non-zero risk of higher oil prices, which would carry inflationary implications. Barring a substantial escalation, market participants believe the impact on U.S. monetary policy will be muted. While equity markets could face some disruption, the probability of a rate hike to combat oil price inflation is low.
* Through Jan. 31
SELF-STORAGE INVESTMENT OUTLOOK
Investment Landscape May Be Loosening;
Greater Activity Likely to Favor the Sun Belt
Multiple factors point to a stabilizing market. In contrast to most other property types, self-storage sales activity increased in 2020 and continued to climb into 2022 before retreating. Positive momentum could be back, however, as the number of trades completed in the six months ended March 2025 were up year over year. For investors considering a change in holdings, macroeconomic conditions have increased the potential costs of waiting. The Federal Reserve is unlikely to notably lower the overnight lending rate without a substantial negative shock to the labor market, while other longer-term borrowing cost benchmarks, such as the 10-Year Treasury, face more potential upward yield pressures than downward. Property fundamentals are also likely to improve over the next 12 to 24 months, with monthly rent rolls allowing for adjustments against inflation. Investors who have been waiting for a drop in interest rates or a rise in distressed sales may now act, as both probabilities are unlikely.
Sun Belt leads investment with high capital targets on the coasts. Sales activity over the past year ended in March picked up across the Southeastern U.S., West Coast and in the Texas/Oklahoma region. Approximately one in every three self-storage trades in that period took place in the Southeast, broadly consistent with the past five years. An ample property inventory and favorable demographics contribute to this prominence. The same is true of the Texas/Oklahoma area, which was the second-most active region at about 25 percent of sales. Before the pandemic, that ratio was closer to 17 percent. The West Coast and Midwest have ceded ground in the five years since the onset of the health crisis, while the Rocky Mountain and Northeast areas each continue to represent about 10 percent of activity. Less standout demographics may be influencing decisions in the Midwest. High entry costs remain a barrier along the country’s coasts, yet it is partially for that reason that these areas remain the most feasible zones to deploy individual capital allotments of more than $10 million.
2025 INVESTMENT OUTLOOK
- Rising expenses hurdle to overcome. The cost to own/operate a self-storage facility has been climbing at an elevated rate since late 2021, based on REIT data. Real estate taxes and on-site management fees remain the largest individual expenses, but insurance costs are becoming a greater concern. Due to a larger number of extreme weather events, there has been a steep rise in replacement costs and an increased frequency of payout. As a result, insurance providers have been pushed to become increasingly strict on guidelines. That said, the year-over-year rate of expense growth is easing, falling to a three-year low pace of 2.0 percent in March.
- Rollover of long-term individual owners sustains runway for market. Private investors continue to be the driving force behind transactions, representing over 75 percent of sellers and 45 percent of buyers over the year ended in the first quarter. About half of the properties that changed hands in that span had a hold period of more than eight years, indicative of the still-large pool of private, long-term owners who could capture appreciation in a sale. Meanwhile, about a fourth of trades had hold periods under three years, and roughly half of those deals involved properties built since 2020, pointing to a liquid segment of the market. That said, this is also partly due to some of the current challenges facing non-stabilized assets.
- Rocky Mountain and Southeast metros gain attention. Over the last 20 years, the distribution of self-storage investment sales has shifted more toward the Rocky Mountain and Southeast regions. Population migration, and the resulting impact on storage rental demand, is driving the shift. Robust development over the past five years has also created options for acquisitions of recently-built product.
*Estimate
*Sales $2.5 million and greater
NET IN-MIGRATION TRENDS
Relocations Shifted Further South Over the Past Five Years
Total Net In-Migration: 2015-2019 vs. 2020-2024
Migration Momentum Moving South
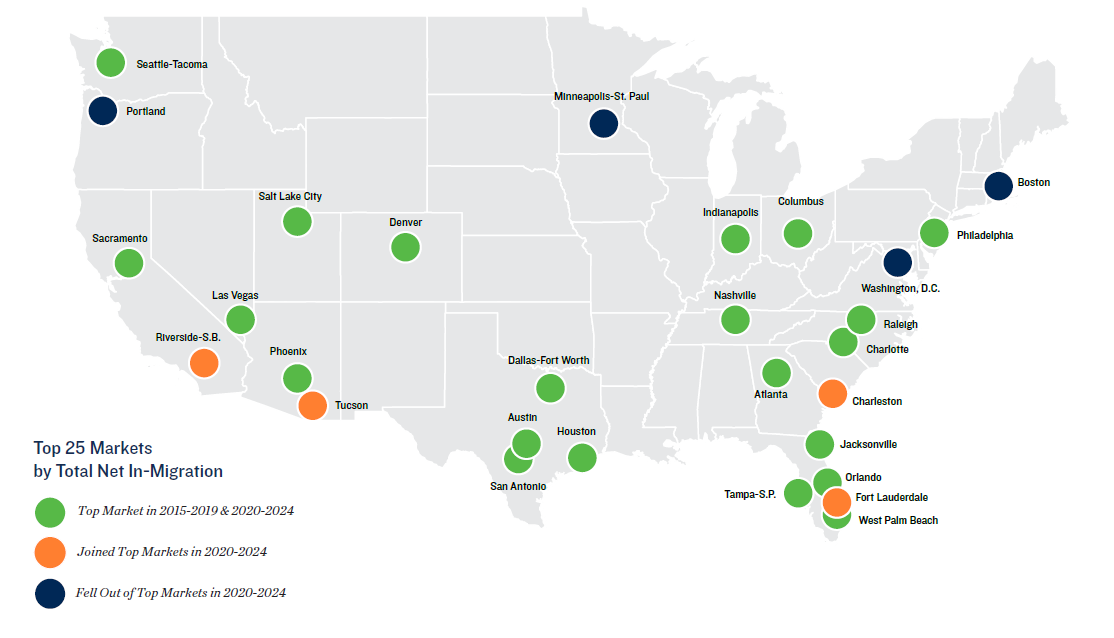
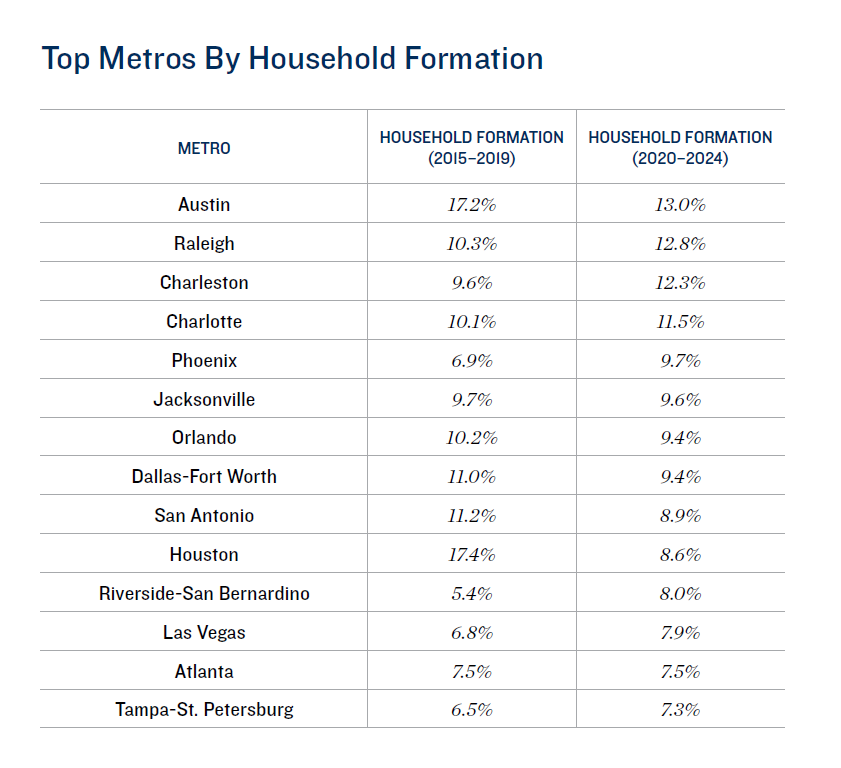
Key ways in-migration has changed since 2015-2019. When comparing the top markets by the total number of people who migrated in on net from 2015 to 2019 with the 2020-2024 period, three trends stand out. First, the pool of top markets moved even more toward the Sun Belt. Boston, Minneapolis-St. Paul, Portland and Washington, D.C., were replaced in the top 25 by Charleston, Fort Lauderdale, Riverside-San Bernardino and Tucson. Second, these additional metros reflect the shift in migration to lower-cost cities within the same general region. Markets like Tucson and Fort Lauderdale may be capturing demand that might have once gone to Phoenix or Miami-Dade, while the Inland Empire welcomes residents from other parts of Southern California with higher living costs. Lastly, across all major markets, net in-migration was down in 2020-2024 compared with 2015-2019, which carries implications for self-storage demand. This trend could continue, especially if economic uncertainty and budget tightening prompt more households to forego costly relocations.
Sources: Marcus & Millichap Research Services; Moody’s Analytics; U.S. Census Bureau
RENT TRENDS
Widening Rent Gap Poses Challenges for the Sector
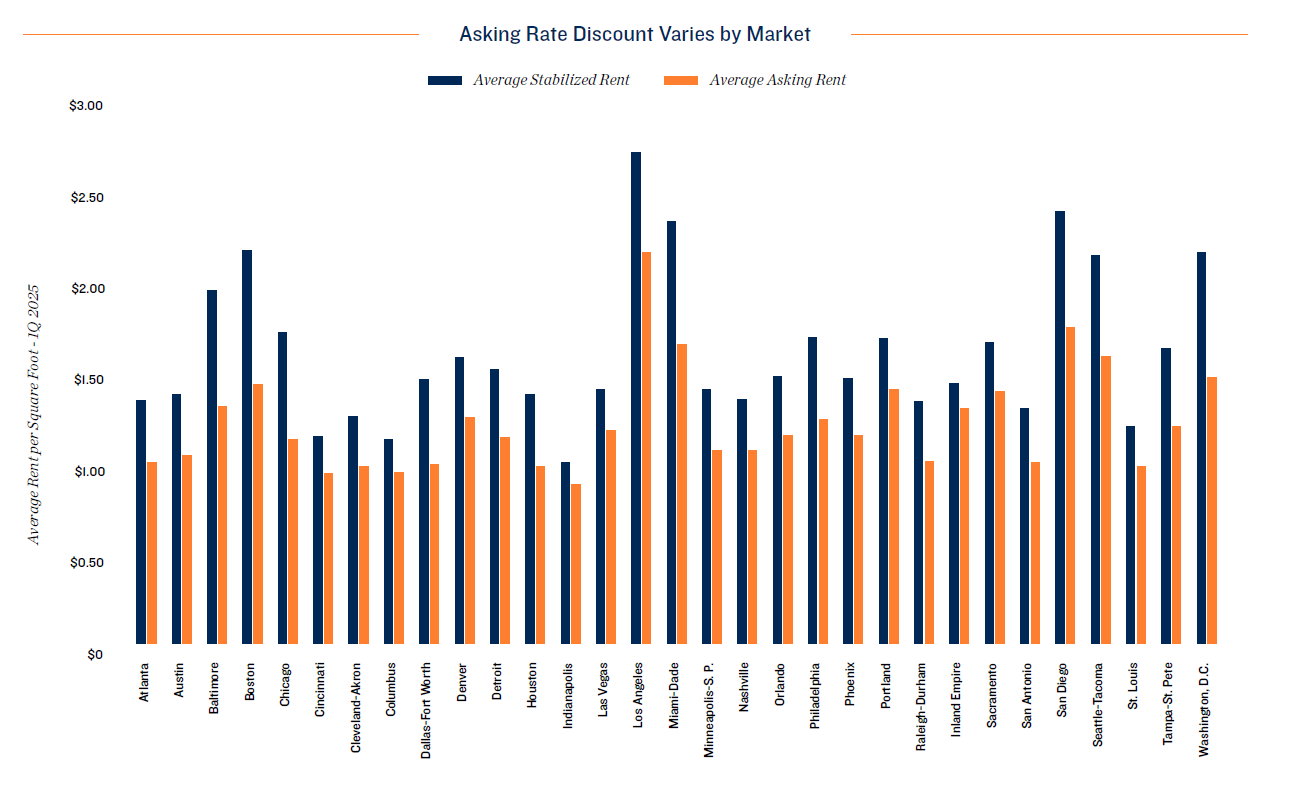
- The loss of COVID-19-motivated demand drivers since early 2022 coincided with an increase in expenses that pressured operators to maximize per-property efficiency. One measure taken was greater price differentiation. Operators with sufficient resources have increased discounts on street rates before subsequently adjusting rates to marketed levels. Over time, this has led to a widening gap between the average asking rent and the overall mean, which reached 43 percent nationally in March.
- The differentiation between asking and stabilized rents is most prevalent in larger markets, where larger owners such as the major self-storage REITs operate. The widest gaps as of March were in Boston, Chicago, Miami-Dade and Washington, D.C. Conversely, some of the narrowest spreads were in Cleveland, Indianapolis, Las Vegas and Riverside-San Bernardino.
- The use of asking rent discounts to augment leasing comes with risks, however. Primary among those is customer tenure. The greater the discount, the longer it may take for rents to rise to market. In 2022, about half of non-commercial self-storage renters had been in place less than a year. Another 25 percent had rented for between one and two years. The nomadic nature of many self-storage renters raises the possibility that the rent discount results in a net loss.
- Another avenue to improve property efficiency is through technology. A security system, automatic gate, kiosks and website are all tools that can reduce the need for on-site labor — the sector’s largest variable expense — as well as improve accessibility for customers. Average wages for self-storage operators has risen 34 percent since 2019, faster than in the overall private sector.
Notes: Average stabilized rent derived from financial filings from self-storage REITs. Average asking
rent is representative of a 10-foot by 10-foot, non-climate controlled unit.
AUSTIN
Robust In-Migration Wrestles With Escalating Supply
Economic Overview
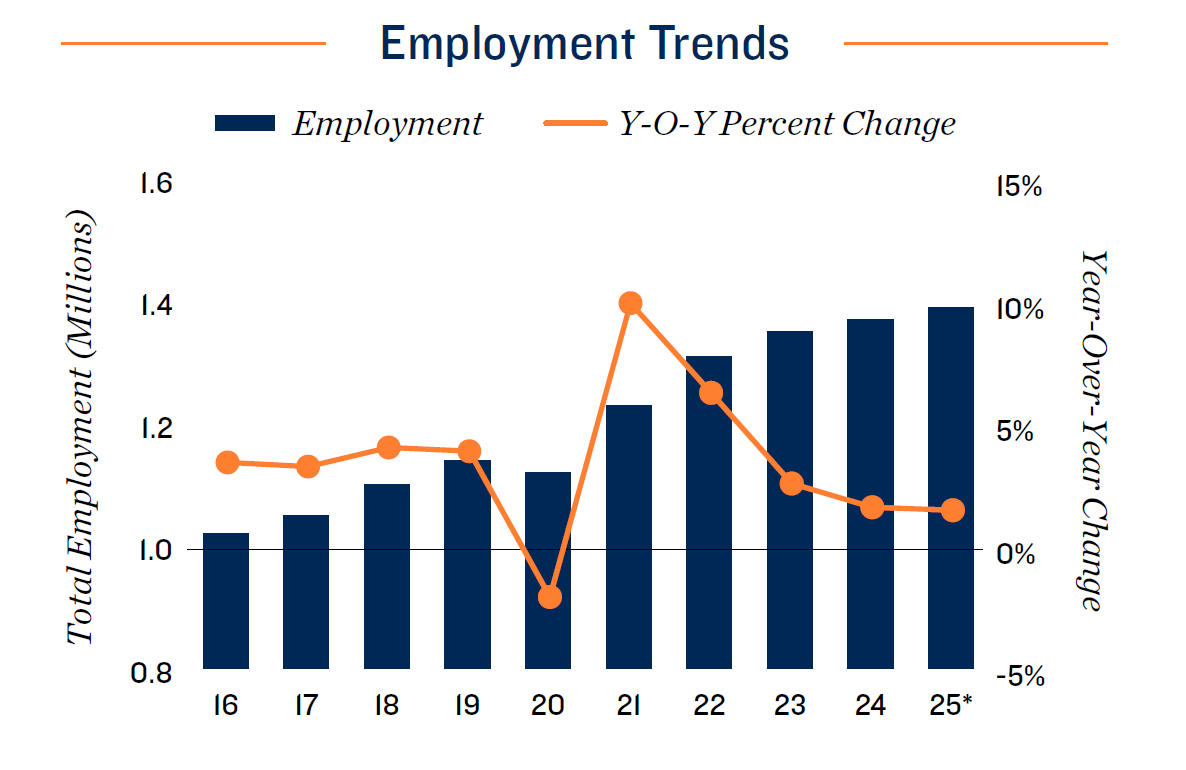
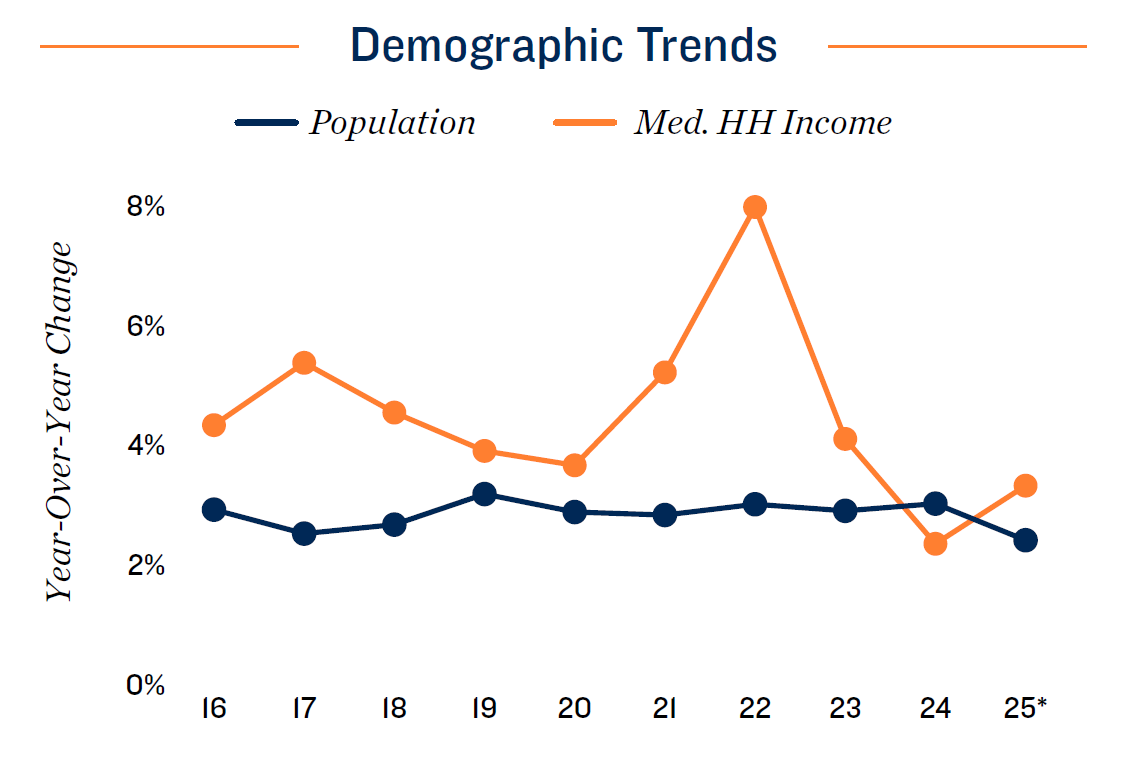
Household income growth has become more subdued in the market over the last three years, falling 120 basis points to 3.2 percent in 2024. Year over year as of March, Austin households’ median income increased by about $3,200 dollars, compared with the national average of $2,800. Demand driven by income effects may soften in response.
Demographic Overview
After dipping in 2023, the metro’s household formation rate rebounded 140 basis points last year to 3.1 percent annually. At the same time, net in-migration reached a record high of 63,000 new residents. The momentum of these forces will carry over to a degree in 2025, aiding self-storage demand from lifestyle transitions.
Construction Overview
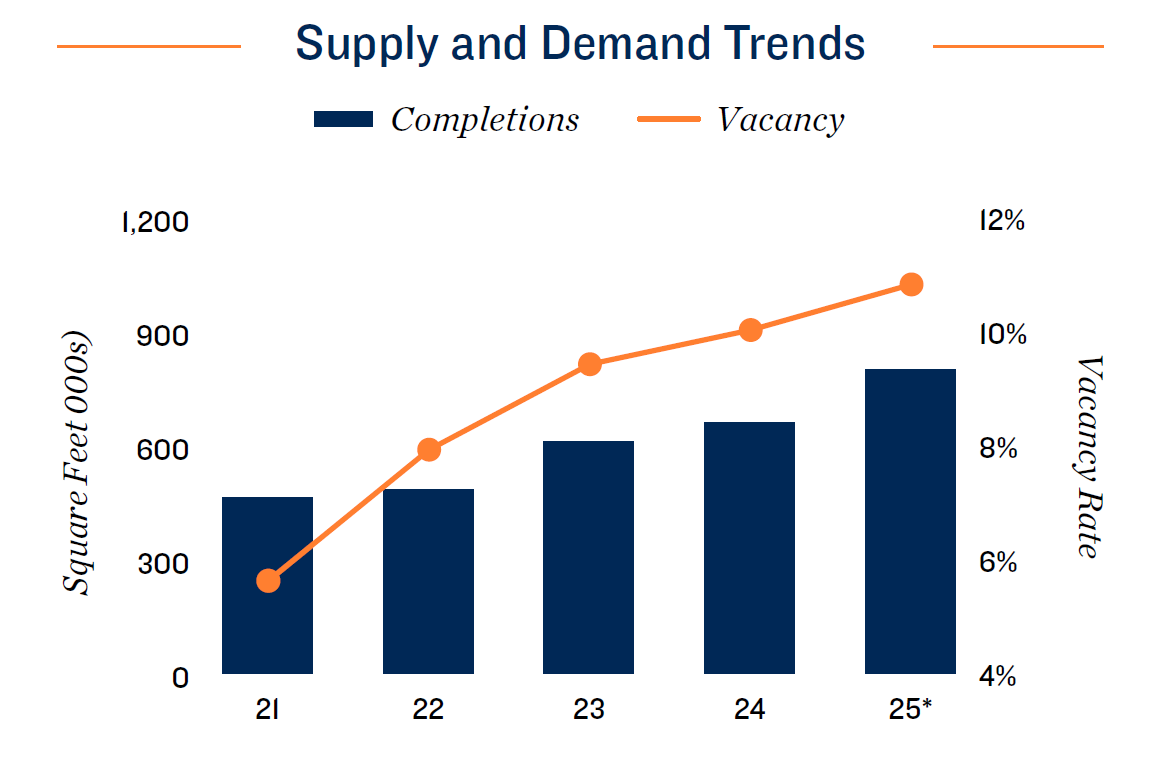
Austin proper leads the metro area in construction with around 332,000 square feet due this year. Dripping Springs and Georgetown can expect almost as much new stock between the two cities combined. Overall, the metro anticipates an increase in construction relative to last year, in contrast to the national trend.
Vacancy/Rent Overview
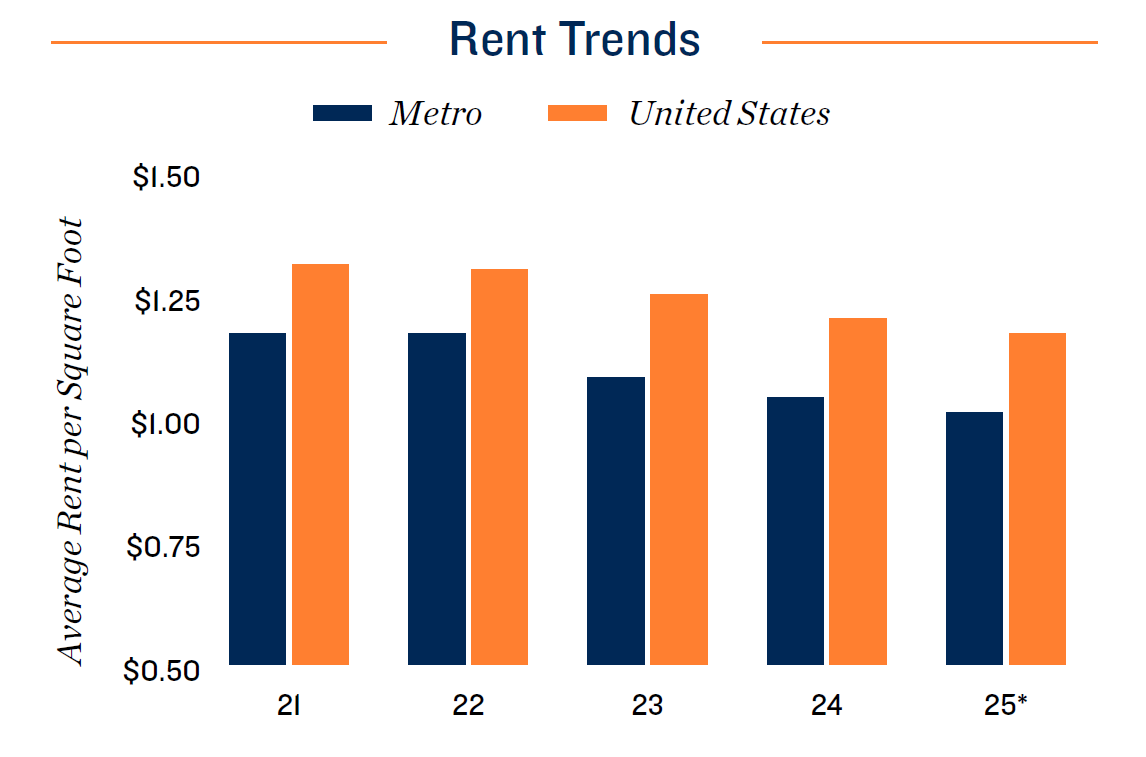
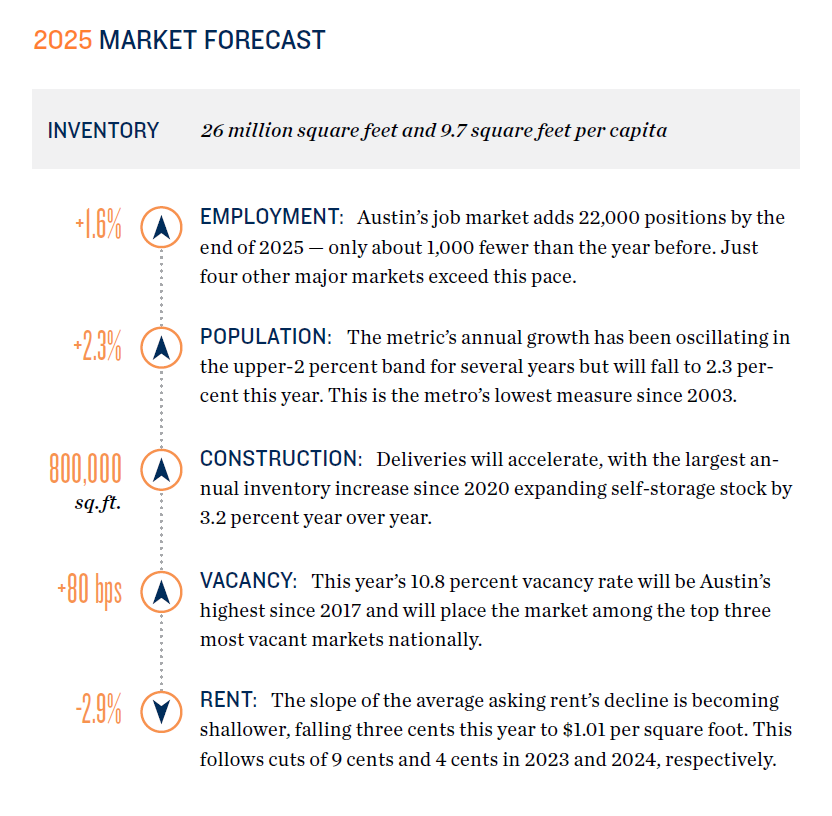
Select brights spots in Austin’s macroeconomics and demographics will only somewhat abate the competition brought by this development, seen first in a lift in the vacancy rate to 10.8 percent. The average asking rent will also continue receding down
to $1.01 per square foot, just below its 2019 value.
* Forecast
Sources: CoStar Group, Inc.; Radius+; Yardi Matrix
DALLAS-FORT WORTH
Demographic Drivers Duel With Overextended Supply
Economic Overview
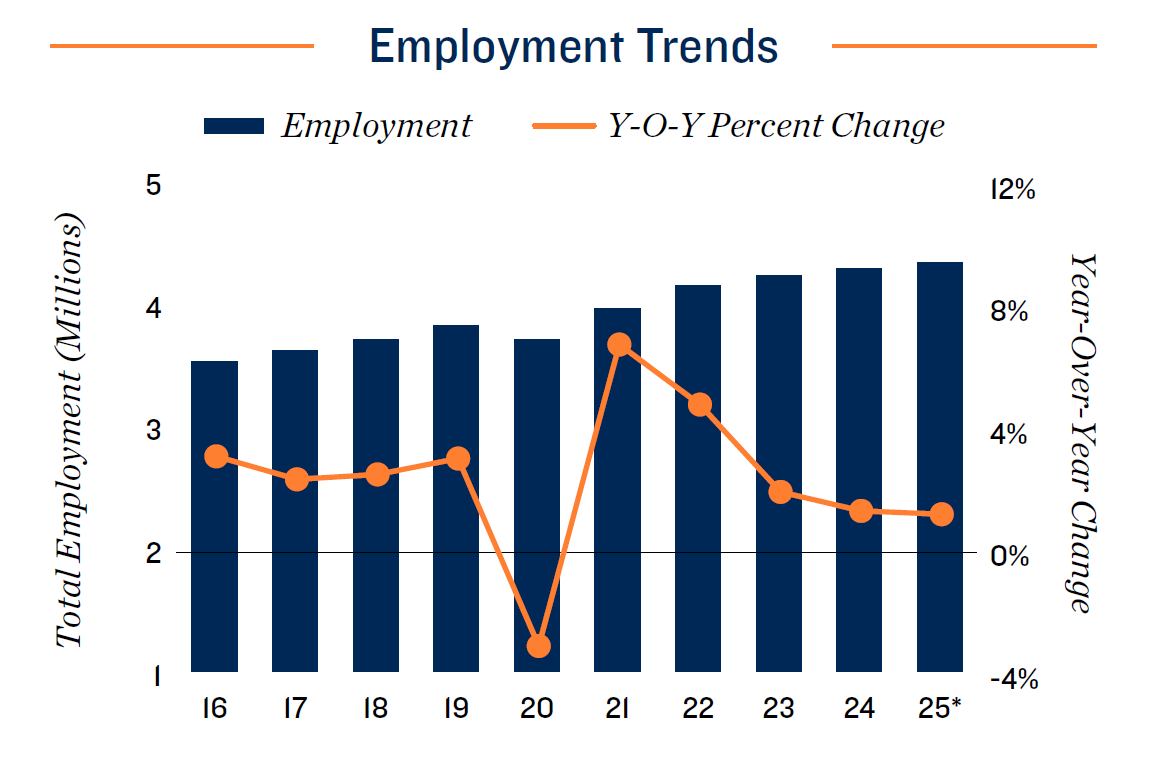
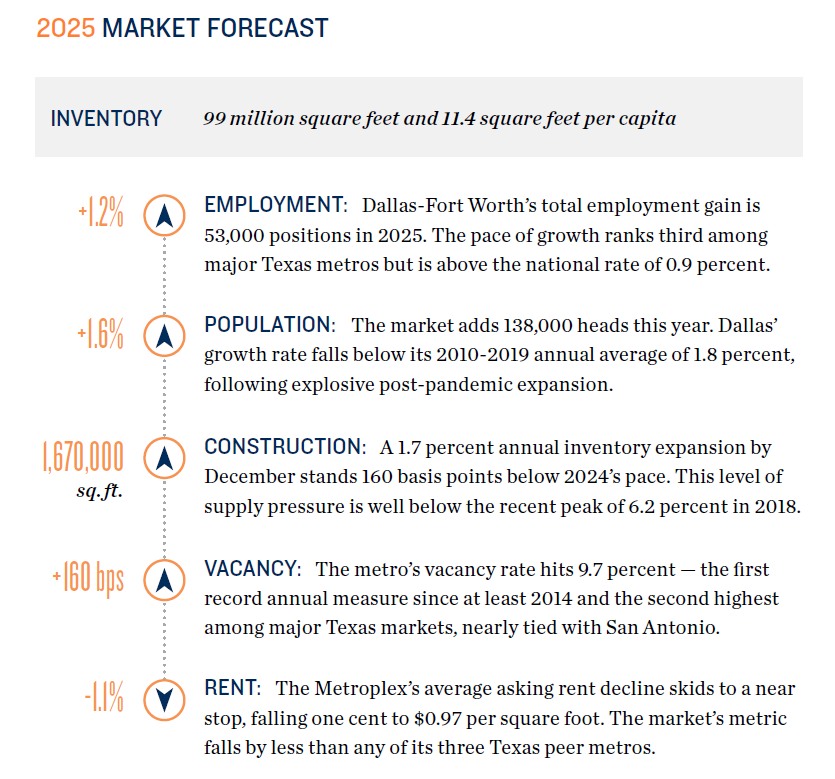
Employment in Dallas-Fort Worth’s government, hospitality and health care sectors expanded by about 1.0 percent to 2.0 percent in the first four months of the year, while the number of professional services roles receded. Those losses were mostly on-trend with the national aggregate, while the market’s gains in government and hospitality stood out. Robust healthcare hiring reflects the area’s ongoing population expansion.
Demographic Overview
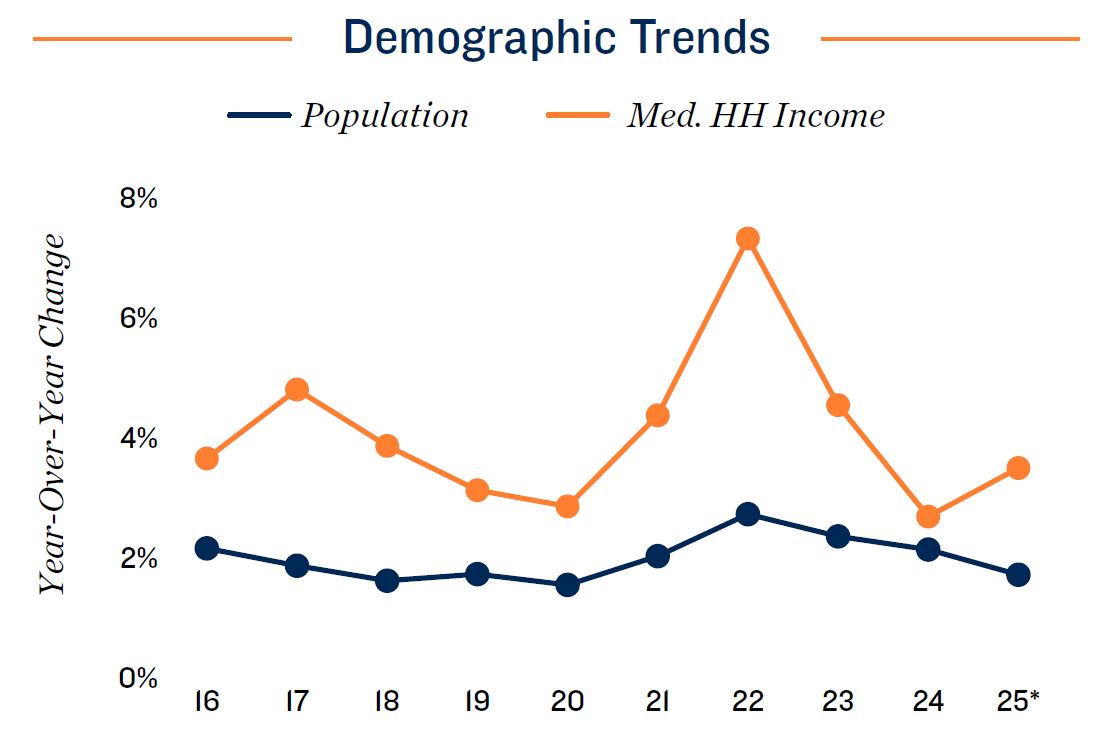
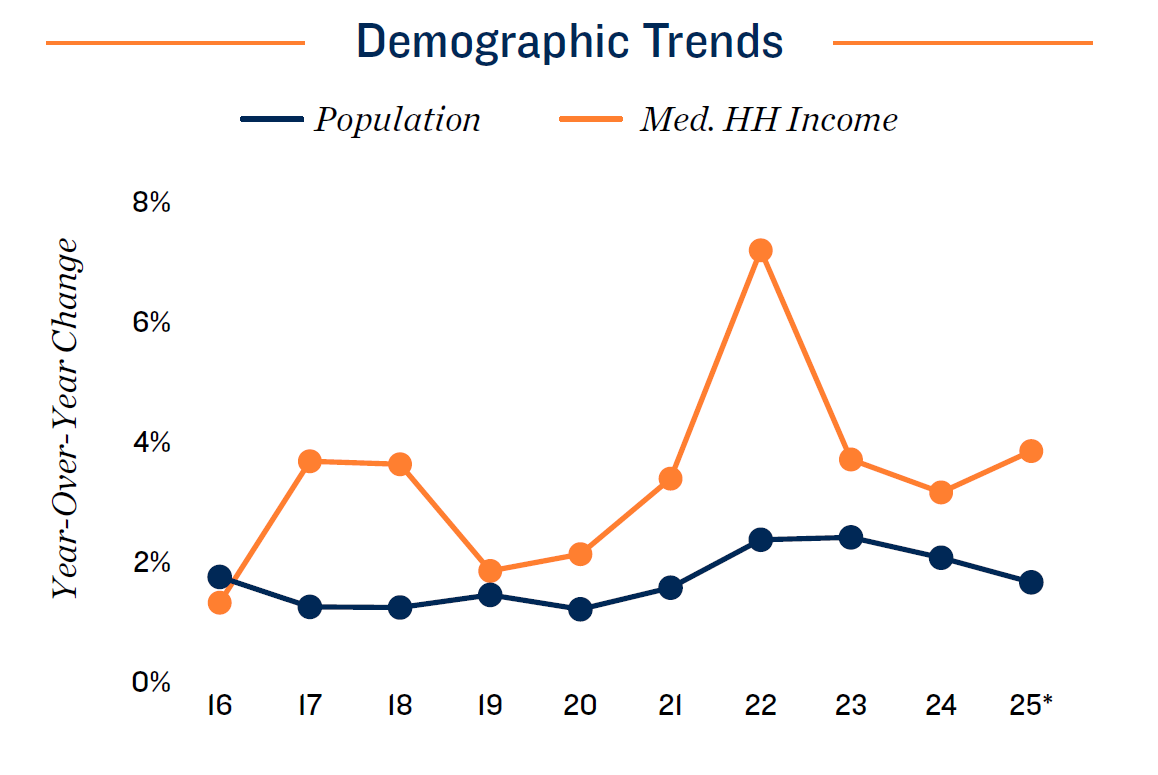
Dallas-Fort Worth’s population growth continues to slow in tandem with net in-migration, though the metro’s resident count still expands 110 basis points faster than the U.S. measure for 2025. This year, the metro is expected to post a fourth consecutive reading of more than 100,000 arrivals, contributing to sustained self-storage demand.
Construction Overview
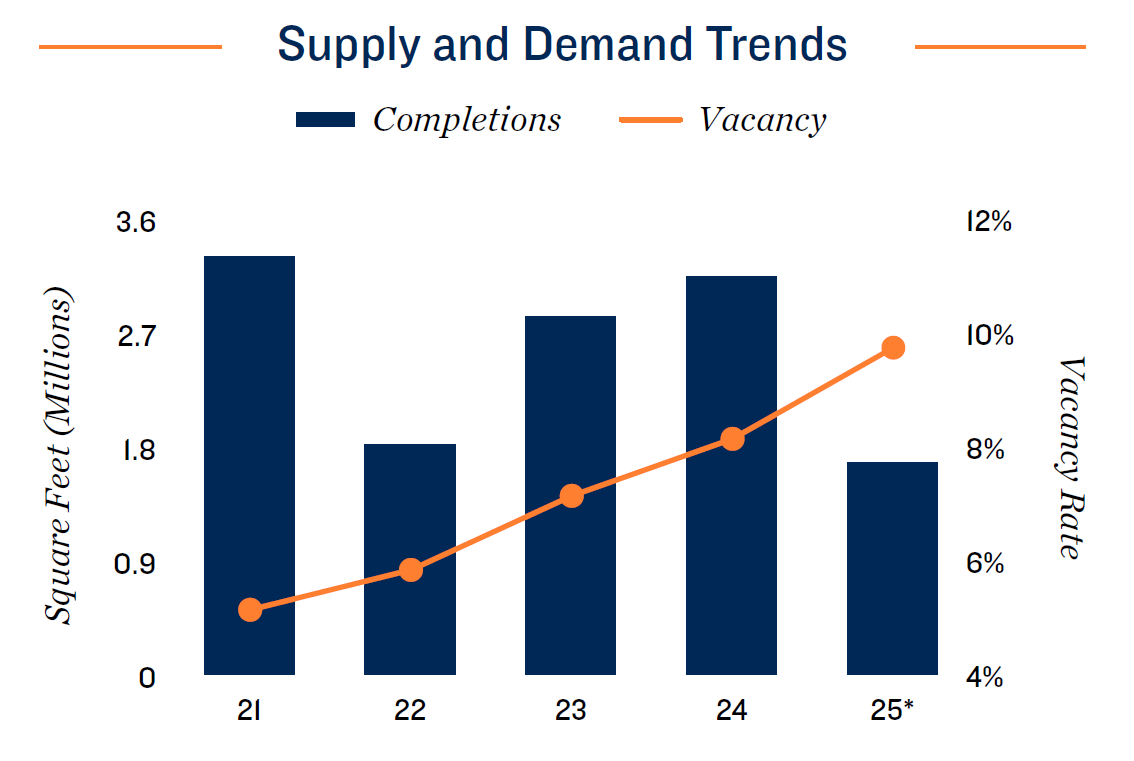
Between 2014 and 2024, the Dallas-Fort Worth metro’s self-storage stock expanded by almost 50 percent. Although a tamer 1.7 million square feet will deliver this year, almost 7 million square feet wait in various planning stages, raising the possibility of higher supply pressure in the future.
Vacancy/Rent Overview
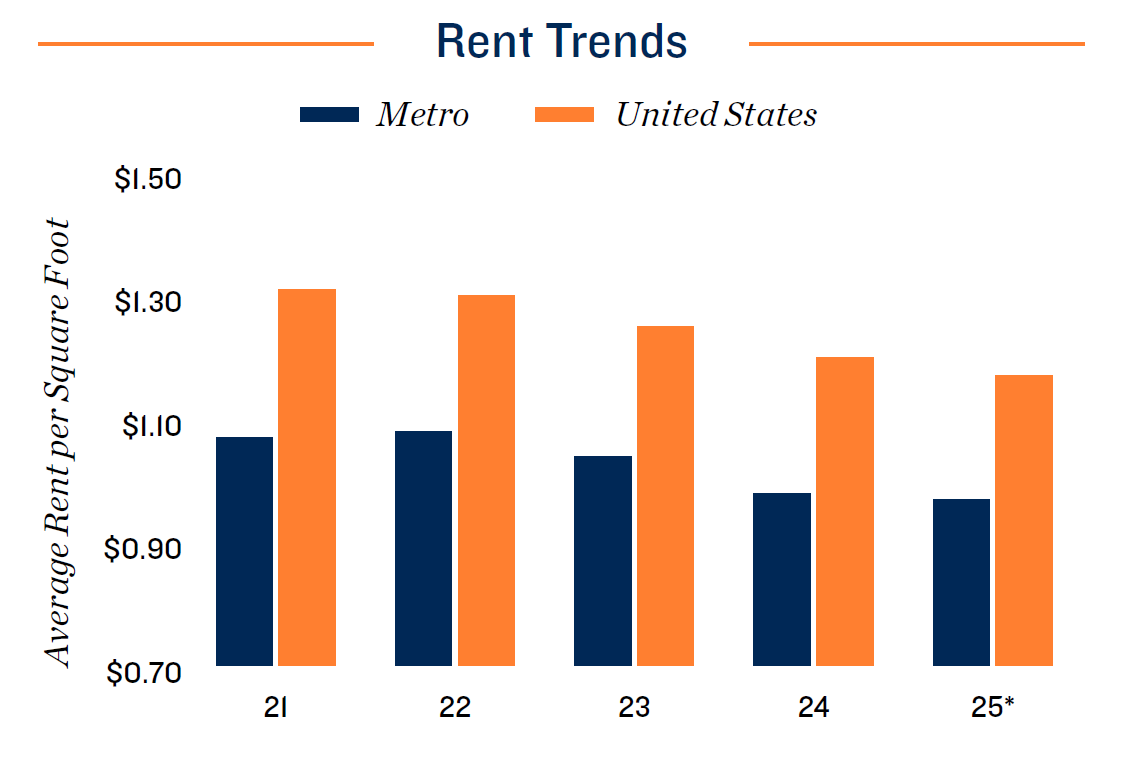
While the desirability of living and working in the Metroplex continues to enlarge the local population and potential self-storage renter pool, the recent history of sustained high supply growth helps to push up vacancy, denying gains in the average asking rent.
* Forecast
Sources: CoStar Group, Inc.; Radius+; Yardi Matrix
HOUSTON
Unique Labor Market Strength Bolsters Vacancy
Economic Overview
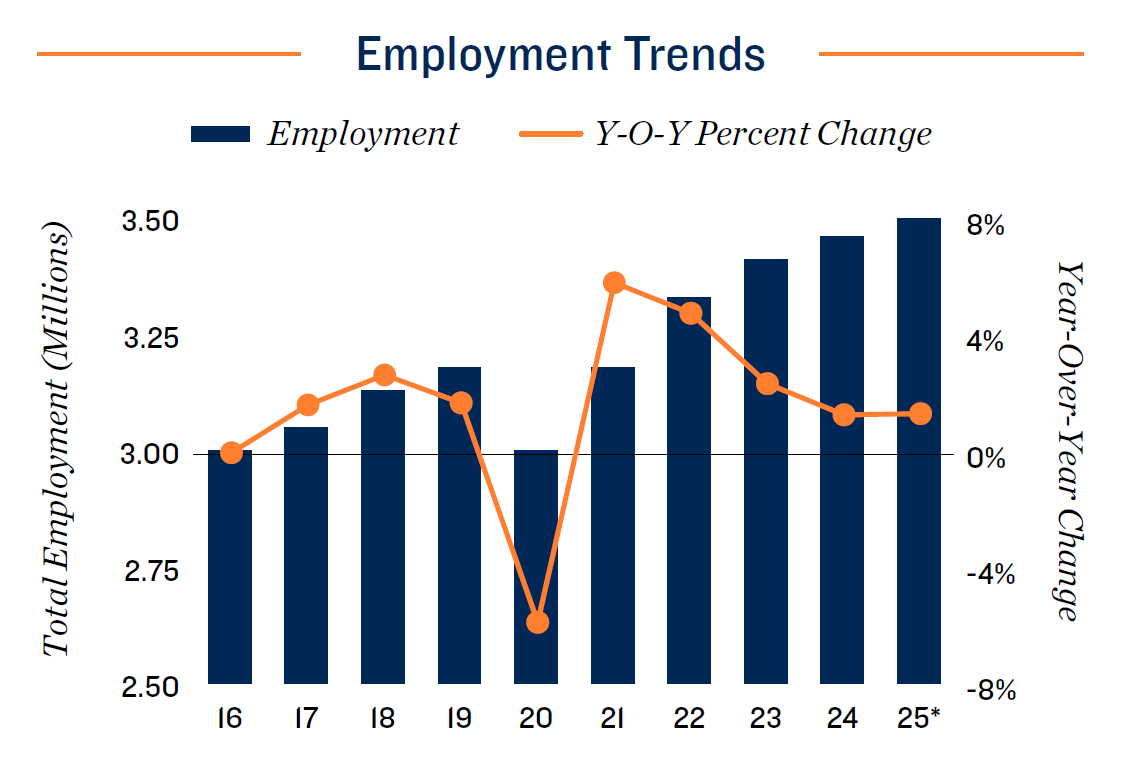
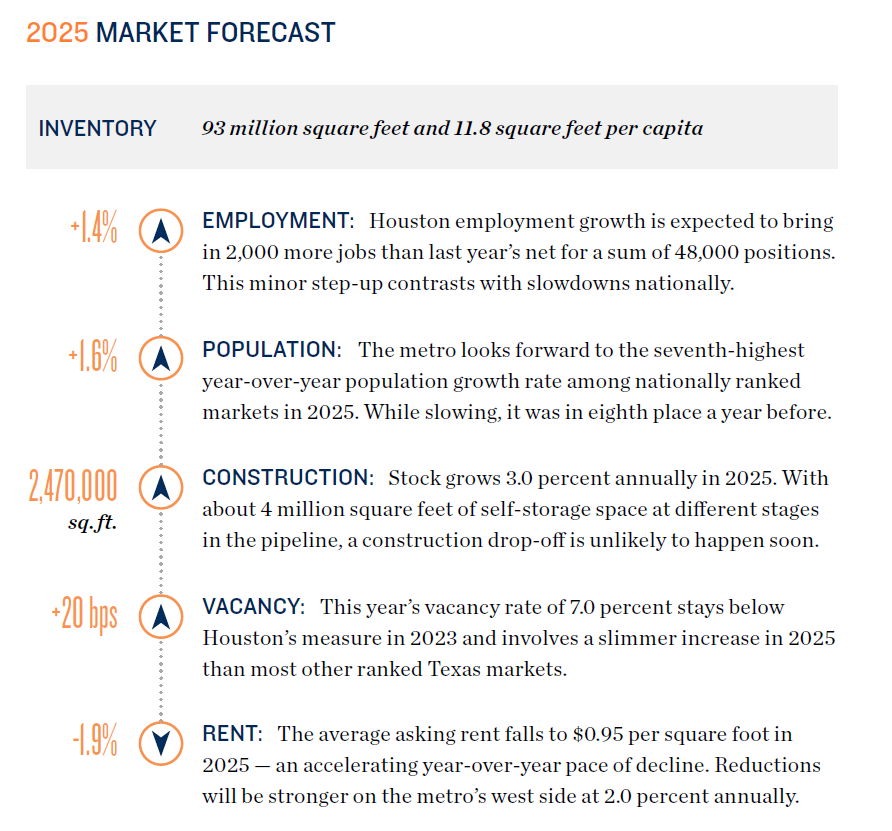
In the first four months of the year, Houston’s unemployment rate stayed close to 4.4 percent — 10 basis points higher than in the same time frame in 2024. Since December, the labor market grew fastest in the information technology, construction and logistics sectors. In contrast, notable losses were seen in natural resource extraction, education and health services, and government.
Demographic Overview
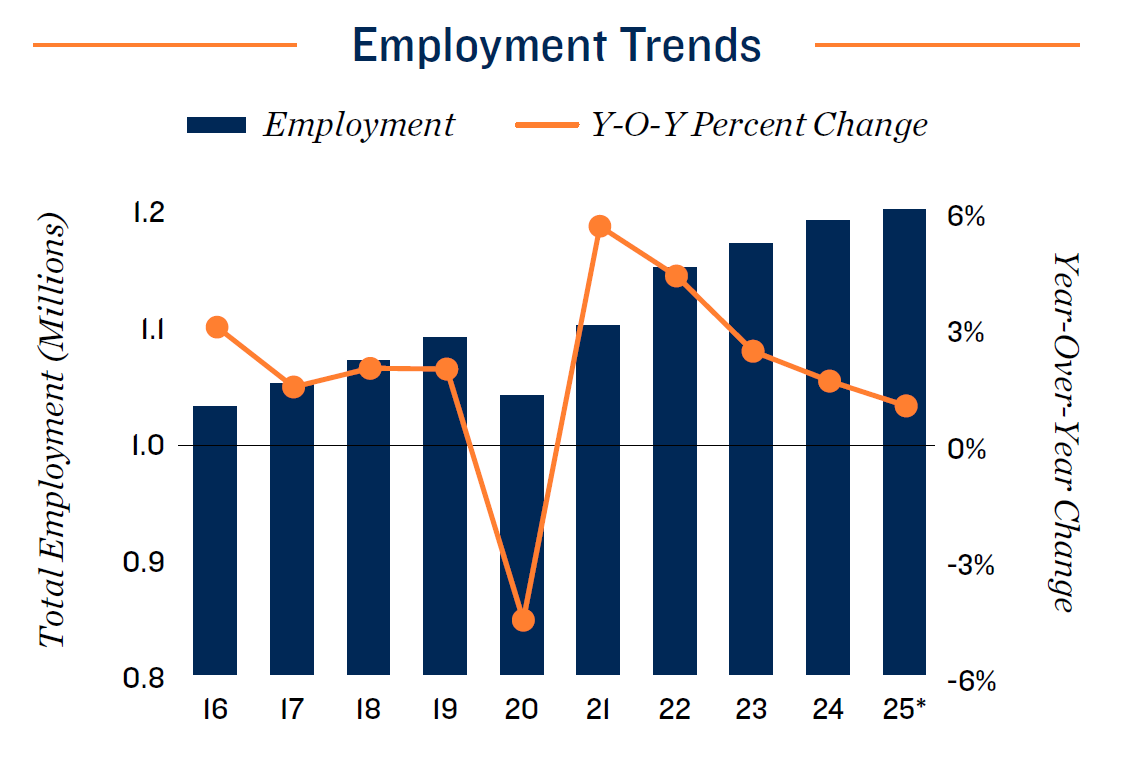
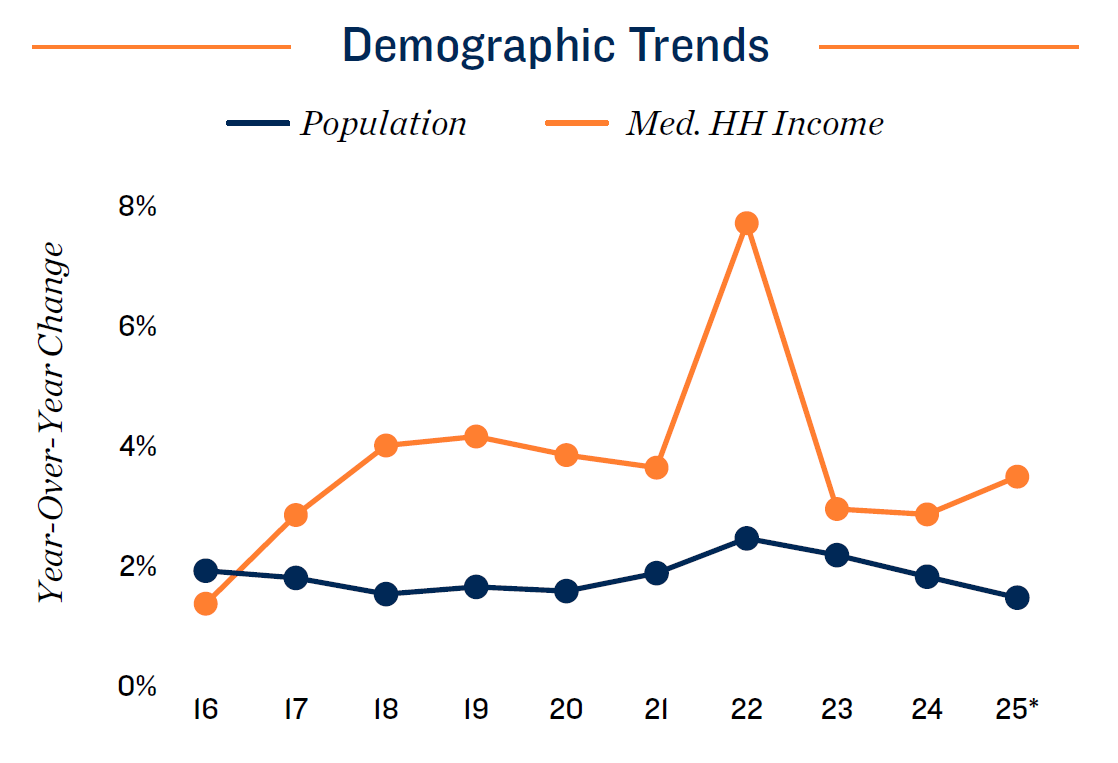
Net in-migration has exceeded 100,000 new residents annually for the last three years. Both the metro’s older and younger population cohorts recorded growth. The number of people older than 65 rose by over 15 percent in that span, and the age 20-34 bracket increased by around 6 percent, boding well for long-term self-storage fundamentals.
Construction Overview
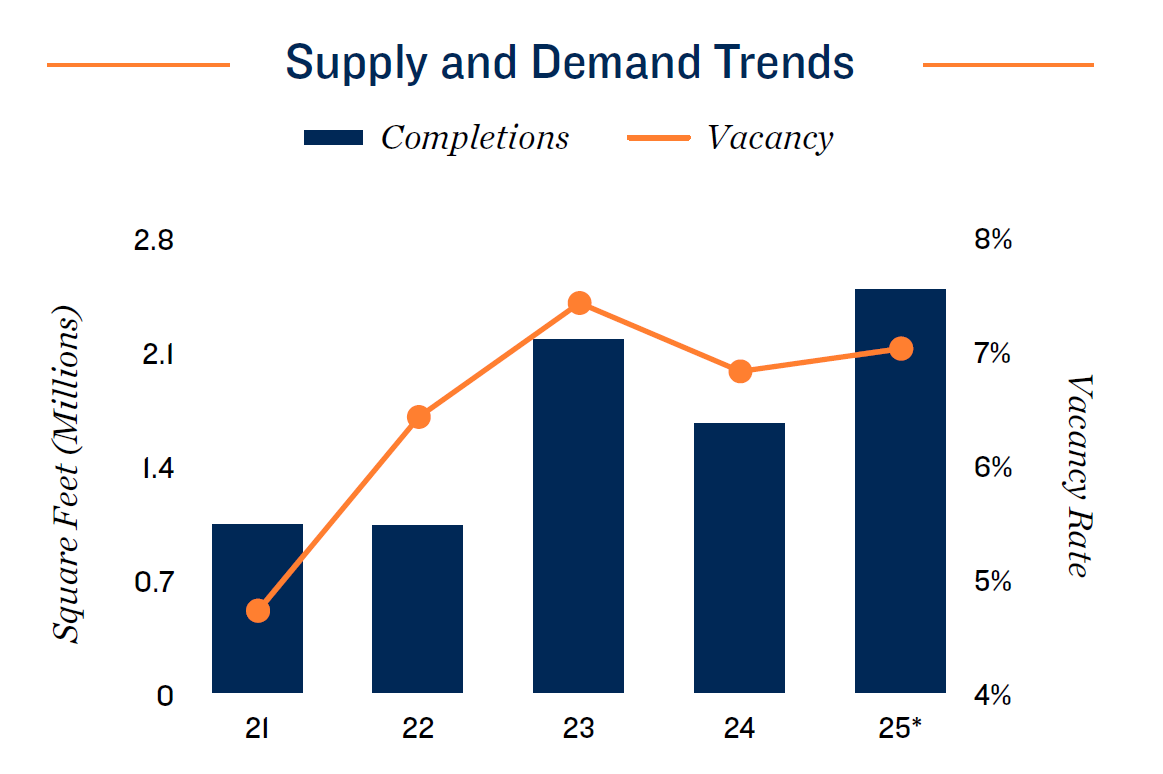
Inventories on both the east and west sides of the metro will expand by nearly 3 percent in 2025, in line with the market’s mean pace since 2017. The average size of a project under construction is roughly 110,000 square feet, with two facilities being over 200,000.
Vacancy/Rent Overview
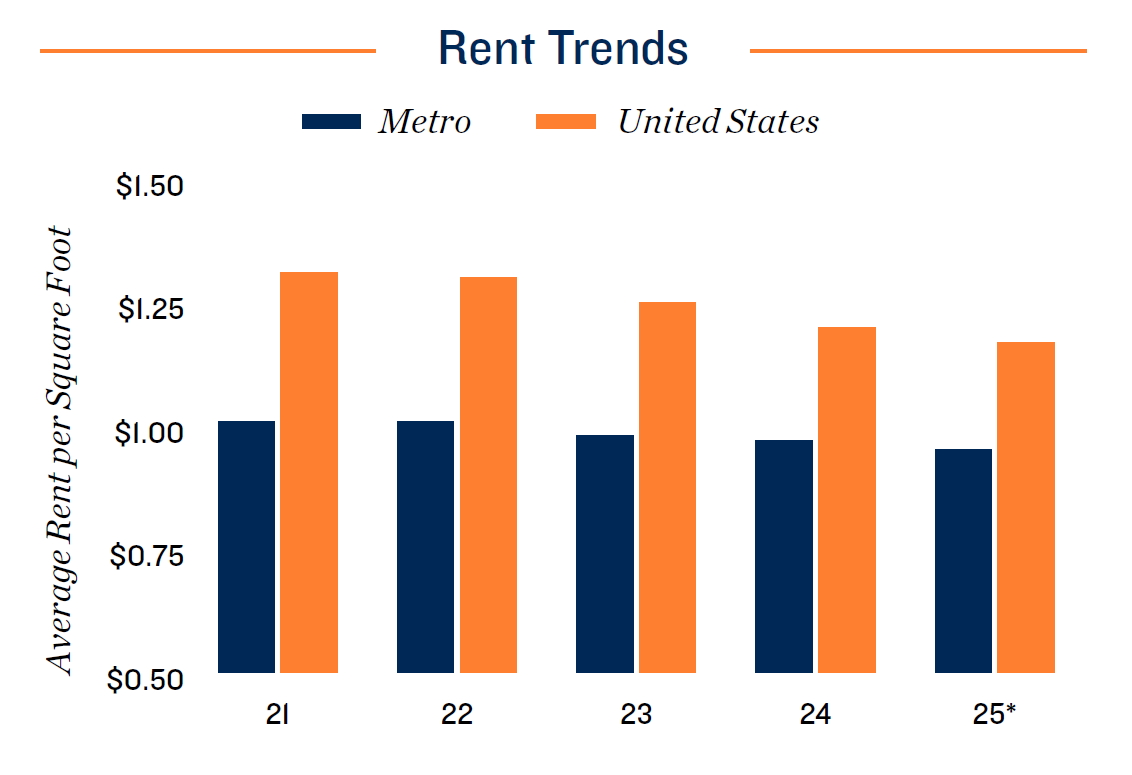
Last year’s vacancy contraction will not extend into 2025 due to increased new supply pressure. The rate’s backslide should be constrained by Houston’s relatively robust pace of job growth, however, which will be one of the fastest among major U.S. metros in 2025. This tailwind will also help blunt the recent downward pressure on asking rents.
* Forecast
Sources: CoStar Group, Inc.; Radius+; Yardi Matrix
SAN ANTONIO
Expanding Renter Cohort Helps Absorb Supply Influx
Economic Overview
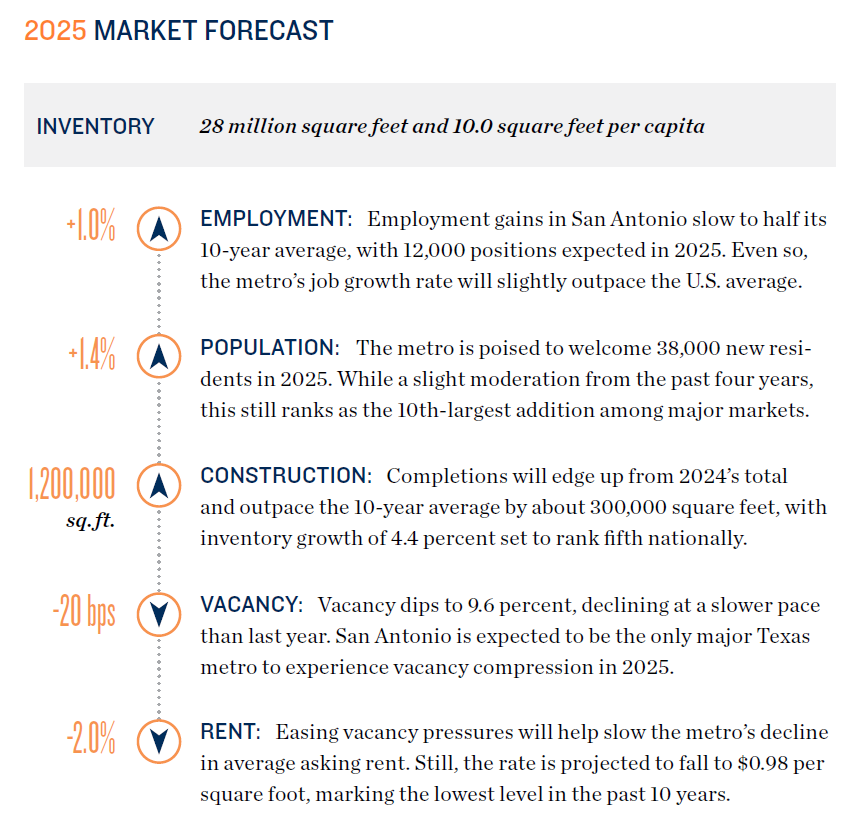
Amid broader uncertainty, stable sectors like health care are supporting hiring, aided by the University of Texas Health San Antonio’s hospital and research facility that opened in December 2024. Meanwhile, Toyota’s expansion this year will add over 400 jobs, while JCB’s 2026 facility is set to create 1,500 jobs, reinforcing long-term growth.
Demographic Overview
Low living costs and expanding job opportunities will help the metro record the fifth-fastest growth rate nationally among the 20- to 34-year-old cohort in 2025. With high barriers to homeownership, many in this group are expected to opt for rentals,
upholding self-storage demand as they adjust to smaller living spaces.
Construction Overview
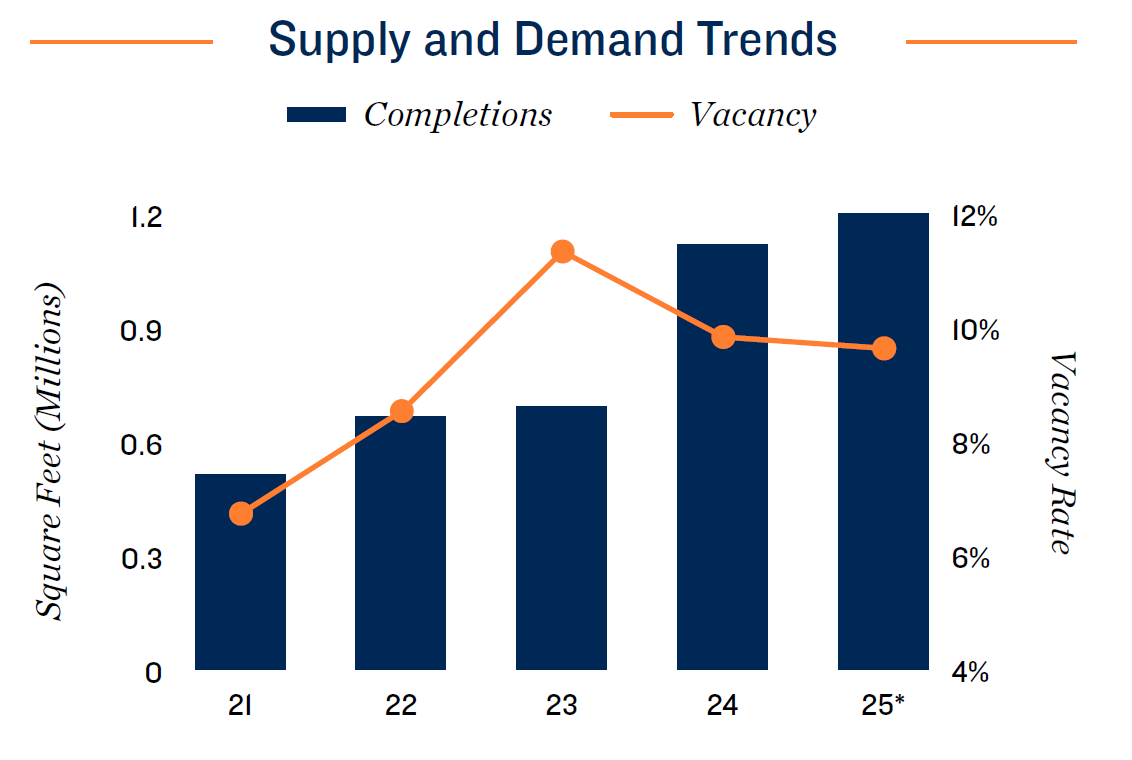
After a slowdown from 2021 to 2023, deliveries are on track to exceed 1 million square feet for a second straight year. By year-end, the metro’s inventory will have grown by over 17 percent since 2020 — the fastest expansion among major Texas markets. While this has pressured fundamentals, strong demographics should continue to support absorption.
Vacancy/Rent Overview
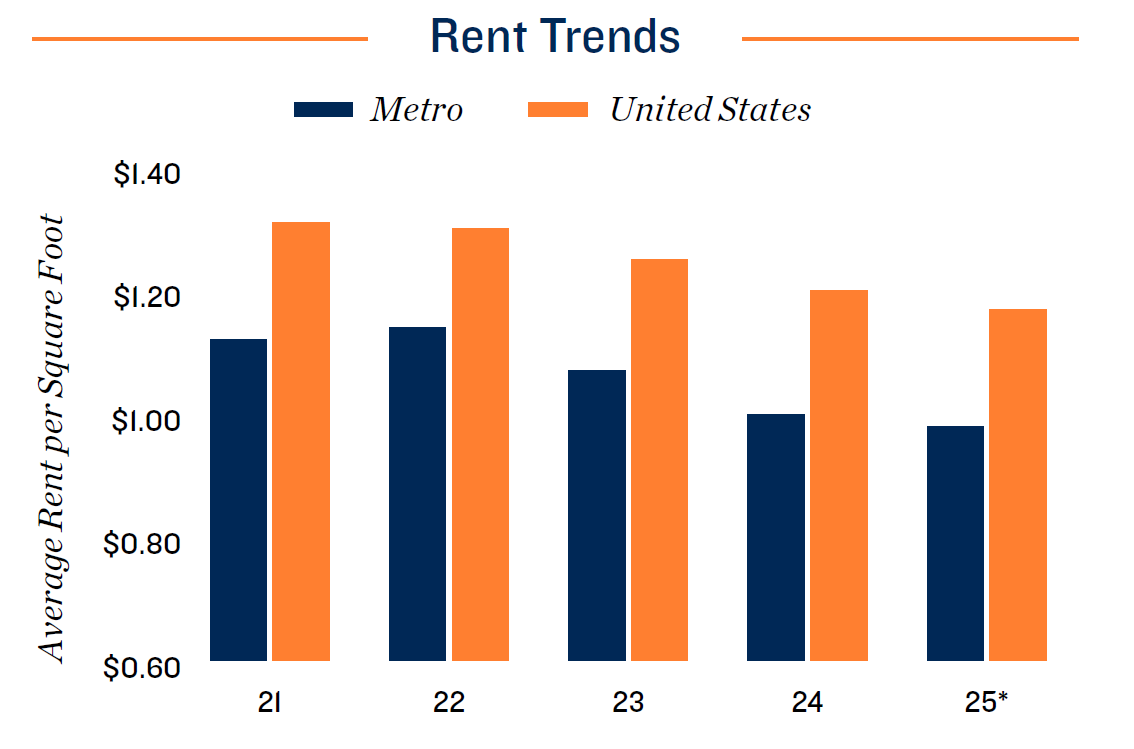
Steady population growth will encourage a continued decline in vacancy, though at a more measured pace compared with 2024 amid softer hiring trends. The metro’s vacancy rate will sit roughly 250 basis points below its 2023 high, which should help slow recent declines in the average asking rent following a 12 percent drop over past two years.
* Forecast
Sources: CoStar Group, Inc.; Radius+; Yardi Matrix
